As a garden lover, we know you placed a lot of effort into maintaining and beautifying your garden. Maintaining your luscious green grass, healthy plants, and alluring flowers requires a lot of effort; which is why you must be careful in keeping out invasive and dangerous plants which might destroy the green paradise you have created. Did you know that there are plants which may look pleasing but can actually destroy your garden? Looks can be deceiving, and with these 10 plants this is no exception. In this post, we’ve listed 10 common plants which you need to avoid to keep your garden safe from invasion and damage.
Make your garden more appealing, find out how to attract butterflies to your garden.
1. Bamboo
Although a bamboo can give your backyard an exotic look, there are measures that you as a gardener need to take to control it. It is in the nature of bamboo to grow and spread rapidly throughout their surroundings. This is what you need to avoid.
If you happen to have bamboo in your backyard, you need to apply plastic or concrete root barriers to prevent its rhizomes from spreading. There are types of bamboo that grow less rapidly and aren’t too invasive. These species include the Bambusa, Borinda, Chusquea, Fargesia and Otatea. The following bamboo types are extremely invasive: Chimonobambusa, Indocalamus, Pleioblastus and Sasa. Of course, if you don’t want to go through the hassle of making barriers then it’s best to avoid planting bamboo.
2. Japanese Stiltgrass
An unstoppable grass that originated from the Eastern part of Asia is the Japanese Stiltgrass. This plant spreads widely and above the ground through seeds and rhizomes. When left unchecked, it creates a grass web trap, causing the other plants around it to starve. Keep in mind that the more you dig the grass out, the more it grows. The reason for this is that the seeds of this plant grow best in loose soil.
3. Purple Loosestrife
It makes sense to grow a purple Loosestrife in your yard as it treats intestinal problems but you need to take a look at the bigger picture. This plant has “Marsh Monster” and “Beautiful Killer” as its nicknames which are already a red flag itself. Purple Loosestrifes invade other vegetation and can also spread very fast. If you find these grasses growing in your yard, dig it out and burn the remains.
4. Chinese Wisteria
A very pretty looking vine which deceives a lot of homeowners. It has a similar appearance to its cousin the Japanese Wisteria which can grow up at least 2 feet in diameter; making it easier to wrap itself tightly around the trees. This wrapping habit is enough to kill some tree species and other plants. If you are able to find this in your garden, remove it immediately from the trees, arbours, and pergolas; and then spray it with a systemic herbicide for a sure kill.
5. Trumpet Vine
Another nosy plant you must avoid in your garden is the trumpet vine. Also known as the trumpet creeper, it can creep up trees and walls tightly. Removing this plant is also a nightmare since it can send shoots very far from the main plant — making it hard to control. Attempting to cut the vine is just a temporary solution. The best way to get rid of this plant is to firmly dig up its mother plant and shoots to clear it from any blooms.
6. Mint (Mentha)
Everyone uses mint to add flavour to their food; plus the fact that it also smells good. However, mint is actually invasive and can cover your whole garden. Avoid this kind of plant if you do not have enough time to take care of it. You can still grow this plant but be sure to place it in a container and keep it in a sunny window indoors. Keep it away from any other garden plants.
7. Japanese Honeysuckle (Lonicera Japonica)
These vines commonly cover the ground, wetlands, roadsides, and forest floors. It can climb for more than 80 feet. If you want to get rid these in your garden, you can pull it out using a shovel. Destroy all of its remains so that it won’t grow again. Never buy it unless you have plenty of time to trim the vines and avoid it from enveloping your garden and home.
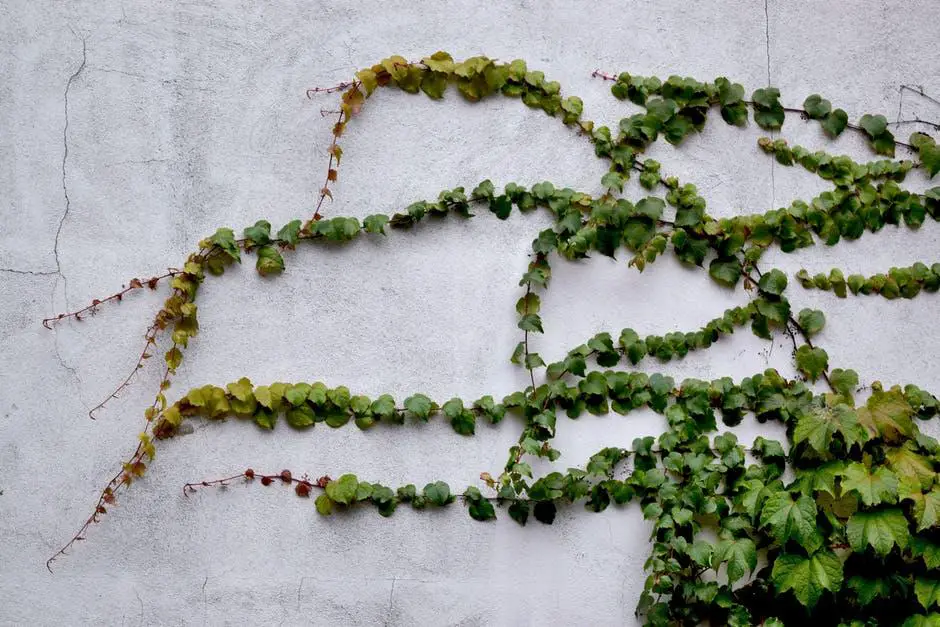
8. English Ivy (Hedera Helix L.)
They grow fast on walls, can reach over your fence, and even cover your ground. It also climbs and chokes your trees. What makes it worse is that it can spread bacterial leaf scorch which is a plant disease that kills maples, oaks, and other native plants.
You can kill English ivy by prying the vines away from the tree or wall. If it is on the ground, you can dump several inches of mulch and leave it there. Many plant lovers love to grow these for decorative purposes; however, they forget how destructive it is because of its rapid growth. Save yourself the trouble and avoid this one in your garden.
9. Belladonna
The common name for this plant is ‘deadly nightshade’ which is a hint that you should stay away from it. Don’t be tricked by its pretty purple flowers and green-rich leaves because it’s actually harmful and toxic. Belladonna has toxic black berries which can be mistaken as an edible fruit by your kids or pets.
10. Mimosa Tree
It’s easy for homeowners to find this tree aesthetically pleasing due to its plumed fern leaves and pink flowers, but you should really think twice if you’re considering to plant this tree in your garden. The mimosa tree is very invasive and can easily spread its seedlings not only in your garden but to your neighbours as well.
If you have any of these plants mentioned, its best to start avoiding them. You should also be vigilant with the plants already growing in your garden.
If you’re looking for alternatives for these plants, have a look at these six plants which naturally repel mosquitoes.
Visit www.drdripplumbing.com.au for more information blogs on home improvement and plumbing.