Since writing up the article on how to build a simple Arduino home energy meter which measured the energy consumption for a single phase, I’ve had a number of people ask about doing a 3 phase energy meter. While there is a range of commercially available single phase energy meters available, the 3 phase meters aren’t nearly as common and tend to be quite expensive. So I decided to take the opportunity to build a 3 phase energy meter and fix up a couple of areas in the original energy meter’s code which could have been done better.
Again, with this meter I was going for simplicity. Sure, for perfectly accurate measurements you need to measure both the supply current and voltage but for this application and in the interests of keeping the energy meter simple and safe – only requiring a non-contact connection to your mains – I’ve decide to stick with a simple current measurement which gives you an estimate to within a couple of decimal points of a kilowatt hour.
This meter measures the supply current through each phase using a CT (current transformer) and then does a few calculations to give you the current, power, maximum power and kilowatt hours consumed for each phase. With a few changes to the code, you can also add your local tariffs and display the cost of electricity used to date.
This project assumes you know the basics of Arduino programming, otherwise read our article on getting started with Arduino, and that you know how to connect an LCD screen to an Arduino.
What You Will Need For A 3 Phase Energy Meter
- An Arduino (Uno used in this guide) – Buy Here
- LCD Shield (Or LCD Screen – how to connect an LCD screen) – Buy Here
- 3 x CTs – Talema AC1030 (See below for options and purchase links)
- 3 x 56Ω Burden Resistors – Buy Here
- 3 x 10µF Capacitors – Buy Here
- 6 x 100K Divider Resistors – Buy Here
How To Make The Energy Meter
First you need to start by assembling your components onto the CTs to create the current sensors which produce a signal which your Arduino can understand. An Arduino only has analogue voltage inputs which measure 0-5VDC, so you need to convert the current output from the CT into a voltage reference and then scale it into the 0-5V input range.
Assemble the Components
If you are going to be installing your power meter somewhere permanently then you may want to solder the resistors and capacitor directly onto each CT so that they cannot come loose. If you are simply trying this project for fun then a breadboard is perfect.
The basic circuit for the connection of the CTs to the Arduino is shown below:
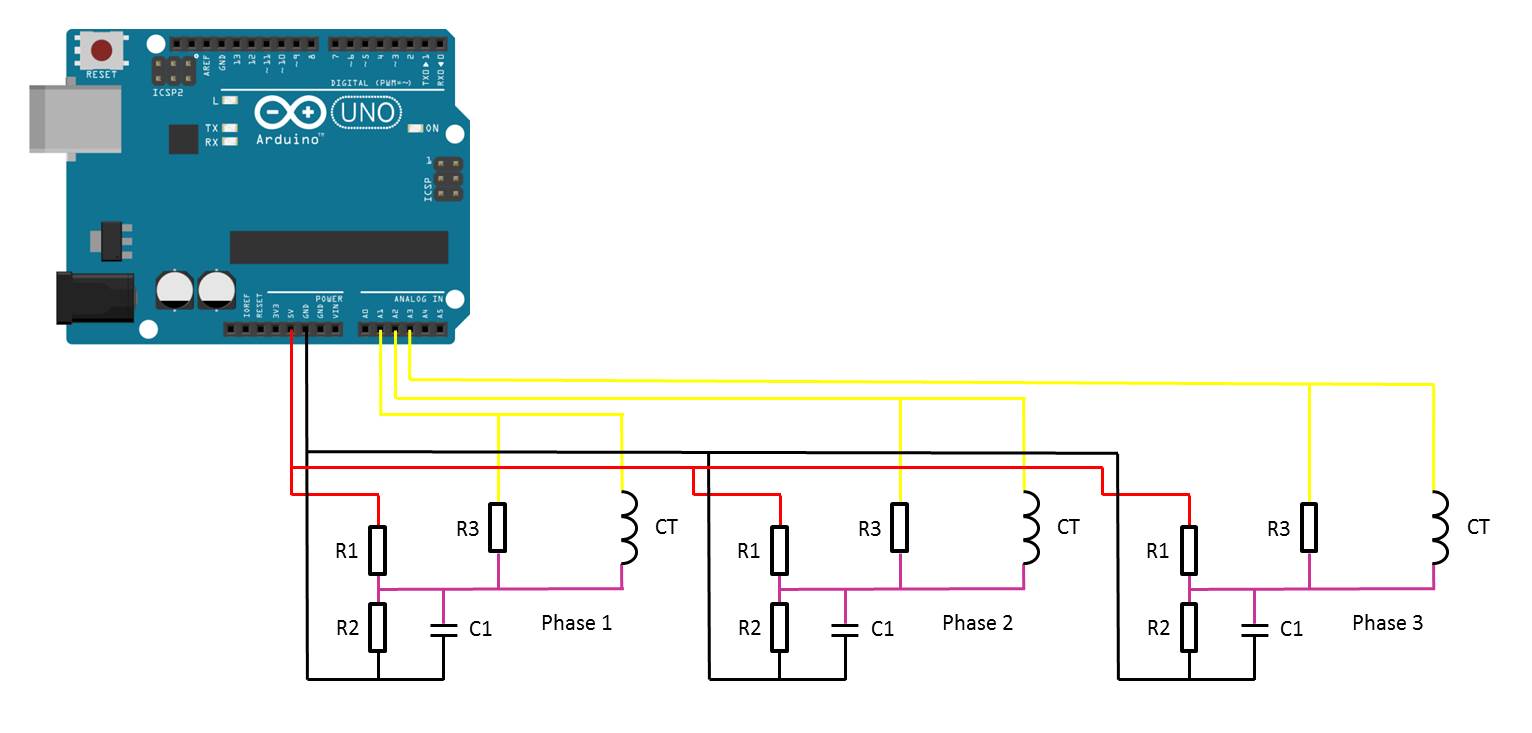
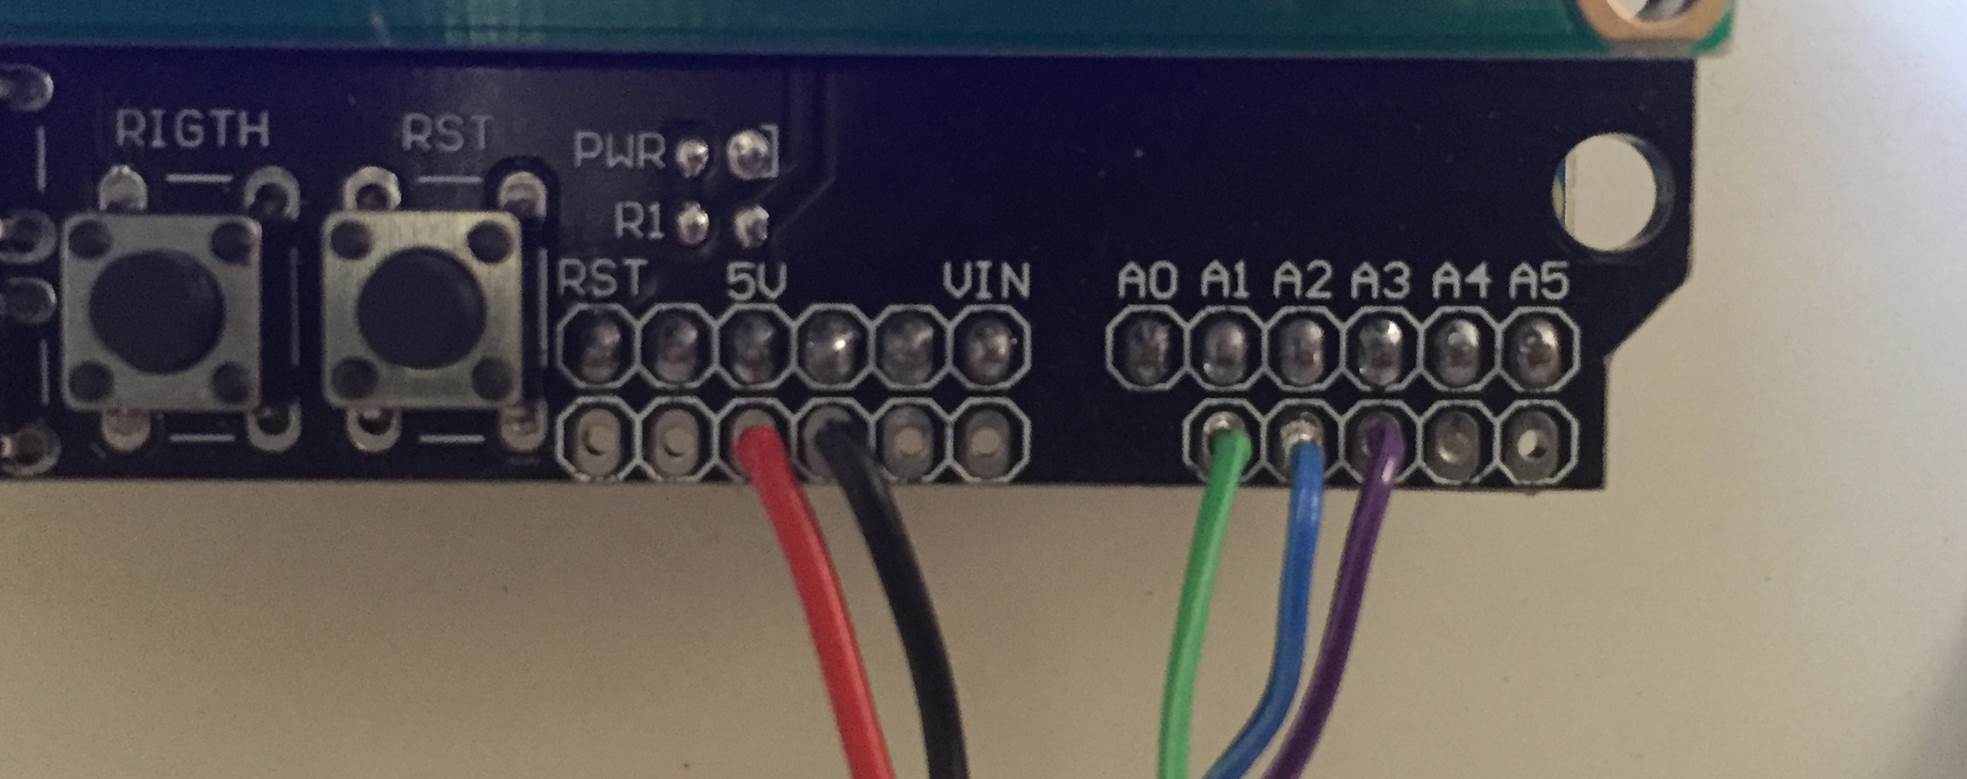
The LCD screen shield already picks up on the analogue inputs but only A0 is used by the shield for the button inputs. Simply solder the five leads from your current sensors onto the pin headers on the shield and use A1 to A3 as your sensor inputs as shown below.
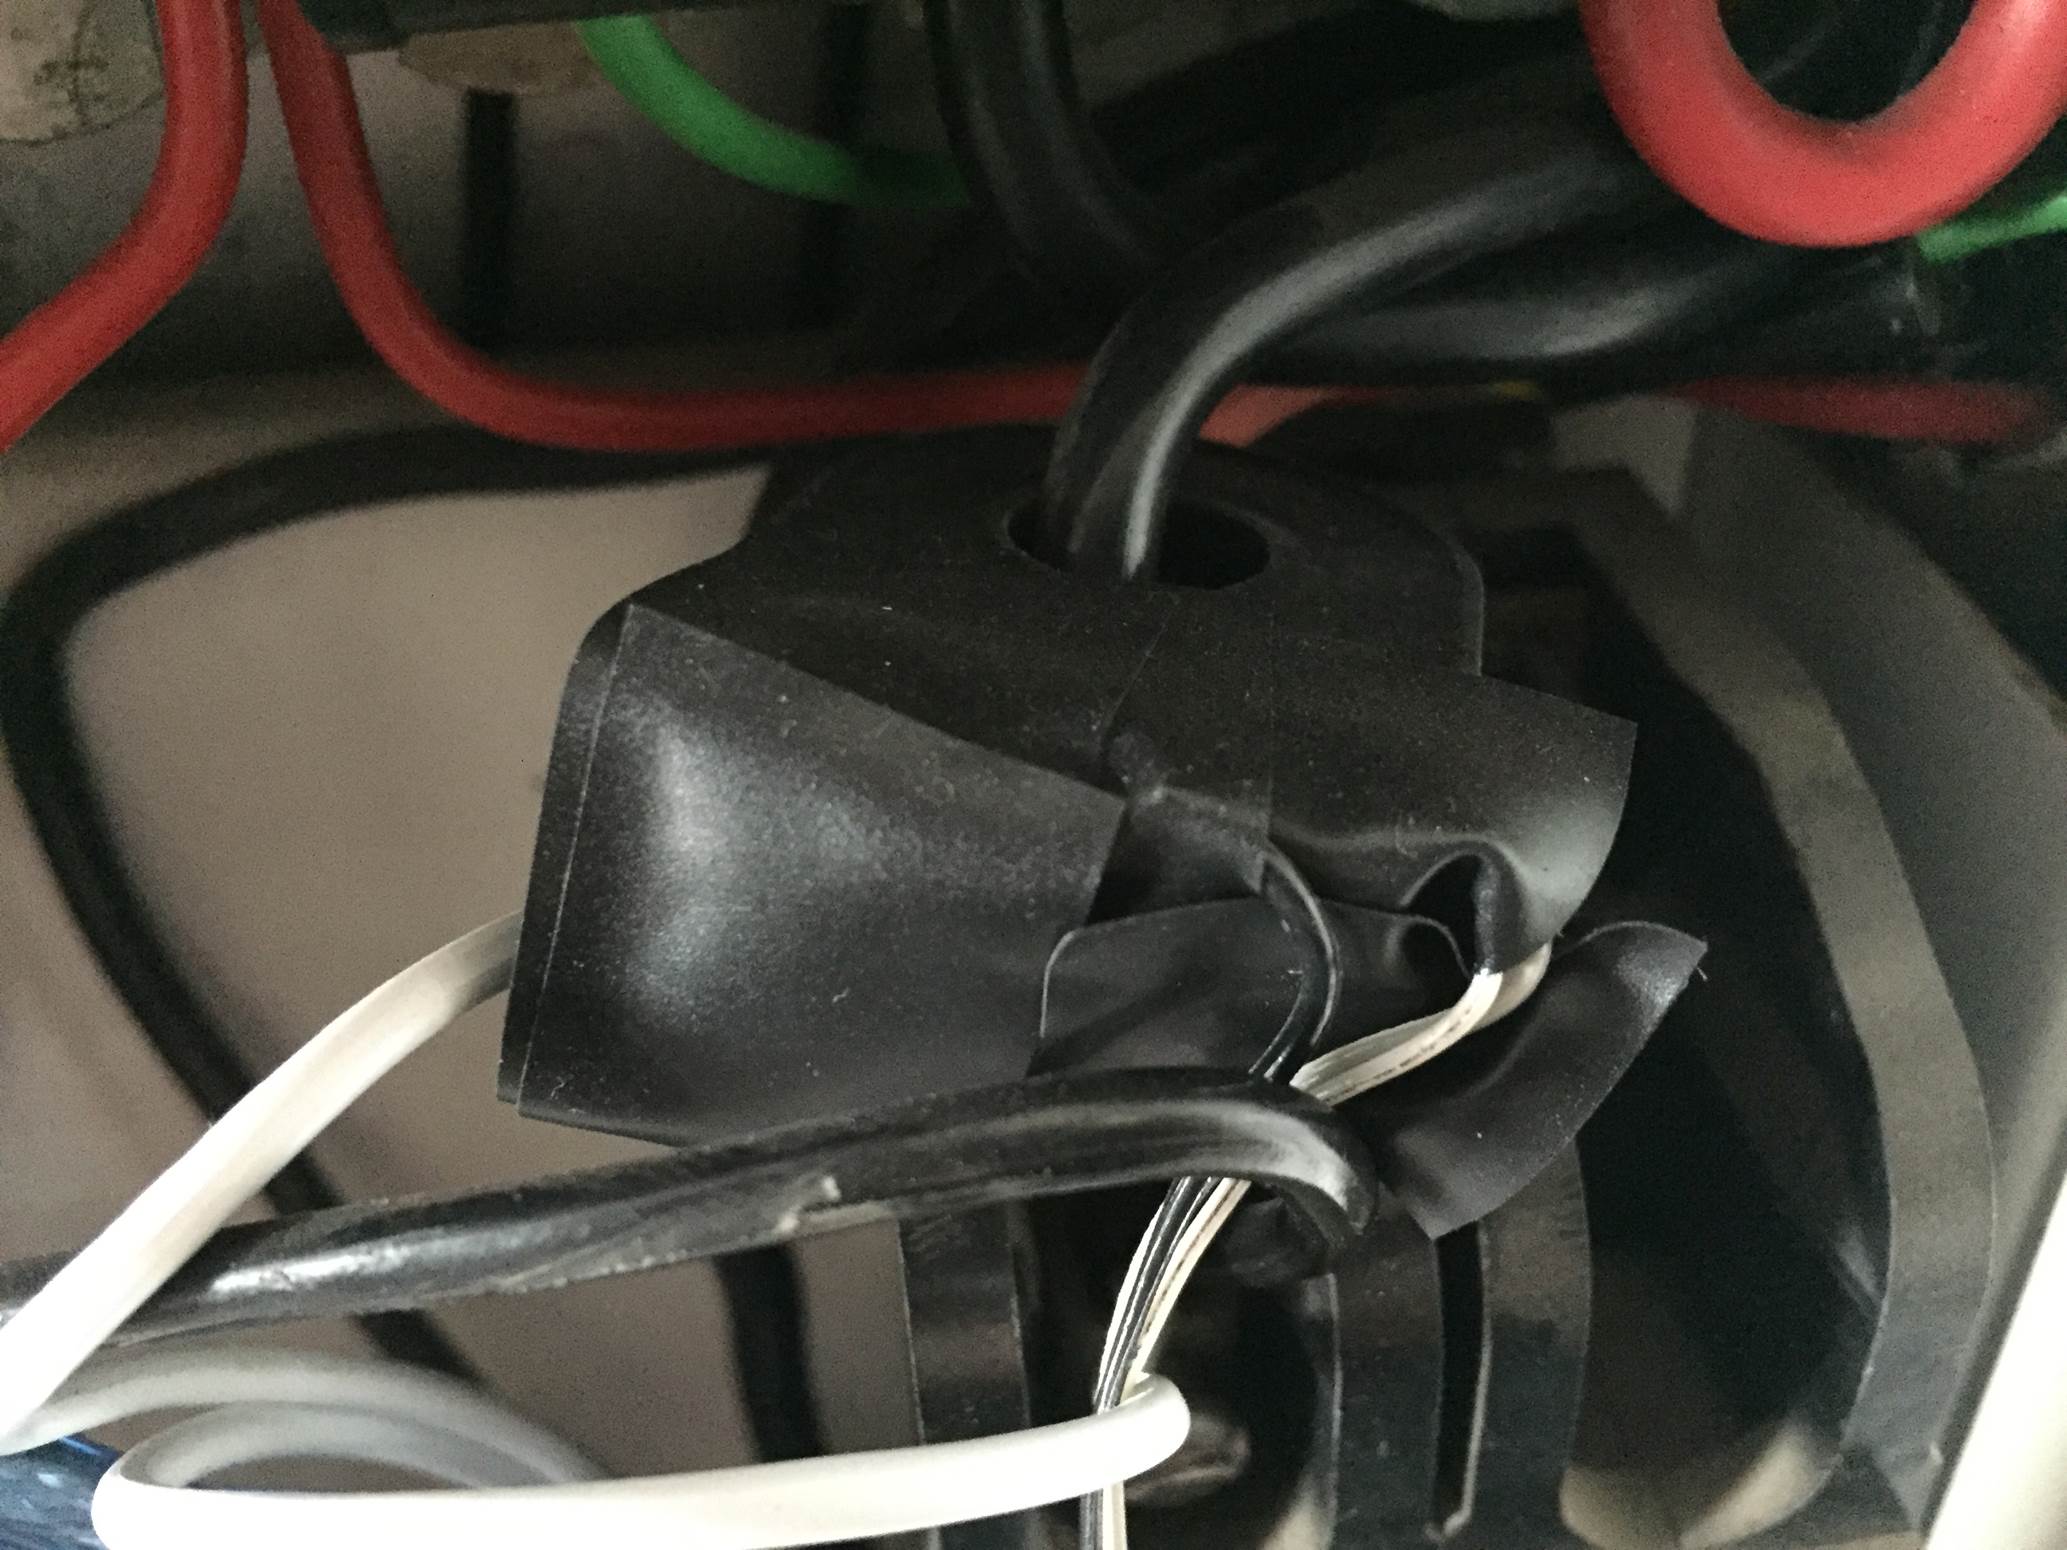
Once you have connected all of your components, you need to connect your sensors onto the supply you want to monitor. For connection to a typical 3 phase mains supply, connect one CT around each of the phases as shown below.
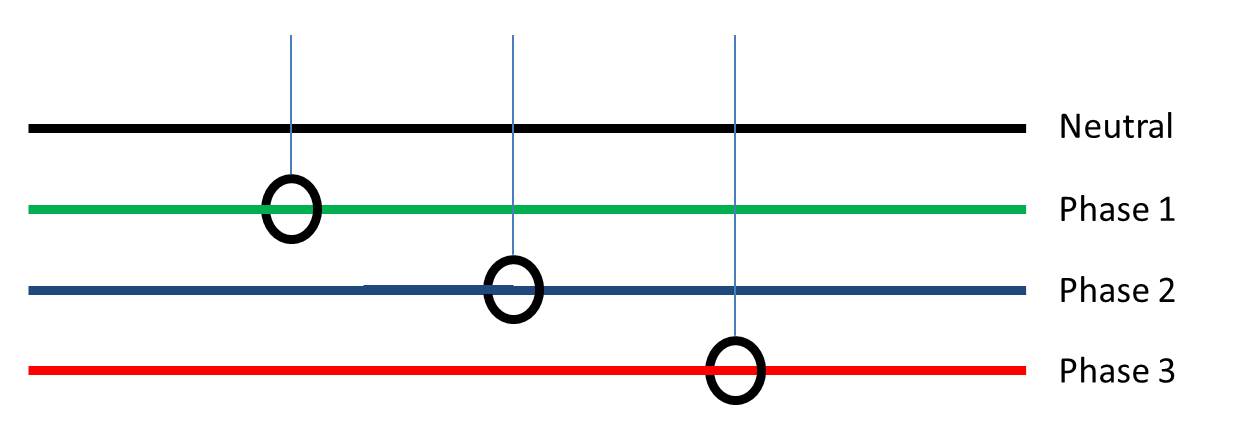
Each CT should only have one wire/phase running through its core.
NB – Be careful when connecting the CTs to your mains and make sure that the power to your board is switched off before doing anything in the mains box. Do not remove any wires or remove any screws before checking your local regulations with your local authority, you may require a certified electrician to install the CT for you.
Choosing Different Components
There are essentially four components which need to be chosen or correctly sized for you energy meter.
Choosing A Current Transformer
The first is the CT or current transformer. The one used here is the Talema AC1030 which can sense 30A nominal and 75A maximum current. At 220VAC, it can theoretically sense up to 16.5kW for short periods of time but it is sized to continuously sense 6.6kW which is suitable for a small household. To calculate how many amps yours needs to sense, take the maximum continuous power your are expecting to sense and divide that by your voltage (usually 110V or 220V depending on your country).
Sizing The Burden Resistor
Next you need to size your burden resistor R3, this converts your CT current into a voltage reference. Start by dividing your primary current (the maximum as used above) by your CT’s turns ratio (available on the data sheet). This should be around 500-5000 to 1. This article worked on 42A with a turns ratio 0f 1000:1 giving a secondary current of 0.042A or 42mA. Your analogue reference voltage to the Arduino is 2.5V so to determine the resistance you use R=V/I – R=2.5/0.042=59.5Ω. The closest standard resistor value is 56Ω, so this was used.
Here are some options on different CTs and their ideal burden resistors (in standard sizes):
- Murata 56050C – 10A – 50:1 – 13Ω
- Talema AS-103 – 15A – 300:1 – 51Ω
- Talema AC-1020 – 20A – 1000:1 – 130Ω
- Alttec L01-6215 – 30A – 1000:1 – 82Ω
- Alttec L01-6216 – 40A – 1000:1 – 62Ω
- Talema ACX-1050 – 50A – 2500:1 – 130Ω
- Alttec L01-6218 – 60A – 1000:1 – 43Ω
- Talema AC-1060 – 60A – 1000:1 – 43Ω
- Alttec L01-6219 – 75A – 1000:1 – 33Ω
- Alttec L01-6221 – 150A – 1000:1 – 18Ω
- CTYRZCH SCT-013-000 – 100A – Built In Burden Resistor – Buy Here
- TOOGOO SCT-013-000 – 100A – Buy Here
The capacitor used is 10µF which should be sufficient for most CT ranges for household applications.
Finally you need two dividing resistors to get the 2.5V reference voltage from the Arduino. They must be the same value, so R1=R2 and we don’t need much current so this articles uses two 100K resistors.
Upload the Sketch
Now you can upload your sketch onto your Arduino, if you haven’t uploaded a sketch before then follow this guide on getting started.
//Michael Klements
//The DIY Life
//26 February 2017
#include <LiquidCrystal.h>
int currentPins[3] = {1,2,3}; //Assign phase CT inputs to analog pins
double calib[3] = {11.8337,11.8234,12.0325};
double kilos[3];
unsigned long startMillis[3];
unsigned long endMillis[3];
double RMSCurrent[3];
int RMSPower[3];
int peakPower[3];
LiquidCrystal lcd(8, 9, 4, 5, 6, 7); //Assign LCD screen pins, as per LCD shield requirements
void setup()
{
lcd.begin(16,2); // columns, rows. use 16,2 for a 16x2 LCD, etc.
lcd.clear();
lcd.setCursor(0,0); // set cursor to column 0, row 0 (the first row)
lcd.print("3 Phase");
lcd.setCursor(0,1);
lcd.print("Energy Meter");
delay(2000);
}
void readPhase () //Method to read information from CTs
{
for(int i=0;i<=2;i++)
{
int current = 0;
int maxCurrent = 0;
int minCurrent = 1000;
for (int j=0 ; j<=200 ; j++) //Monitors and logs the current input for 200 cycles to determine max and min current
{
current = analogRead(currentPins[i]); //Reads current input and records maximum and minimum current
if(current >= maxCurrent)
maxCurrent = current;
else if(current <= minCurrent)
minCurrent = current;
}
if (maxCurrent <= 517)
{
maxCurrent = 516;
}
RMSCurrent[i] = ((maxCurrent - 516)*0.707)/calib[i]; //Calculates RMS current based on maximum value and scales according to calibration
RMSPower[i] = 220*RMSCurrent[i]; //Calculates RMS Power Assuming Voltage 220VAC, change to 110VAC accordingly
if (RMSPower[i] > peakPower[i])
{
peakPower[i] = RMSPower[i];
}
endMillis[i]= millis();
unsigned long time = (endMillis[i] - startMillis[i]);
kilos[i] = kilos[i] + ((double)RMSPower[i] * ((double)time/60/60/1000000)); //Calculate kilowatt hours used
startMillis[i]= millis();
}
}
void loop() //Calls the methods to read values from CTs and changes display
{
readPhase();
displayKilowattHours ();
delay(3000);
readPhase();
displayCurrent ();
delay(3000);
readPhase();
displayRMSPower ();
delay(3000);
readPhase();
displayPeakPower ();
delay(3000);
}
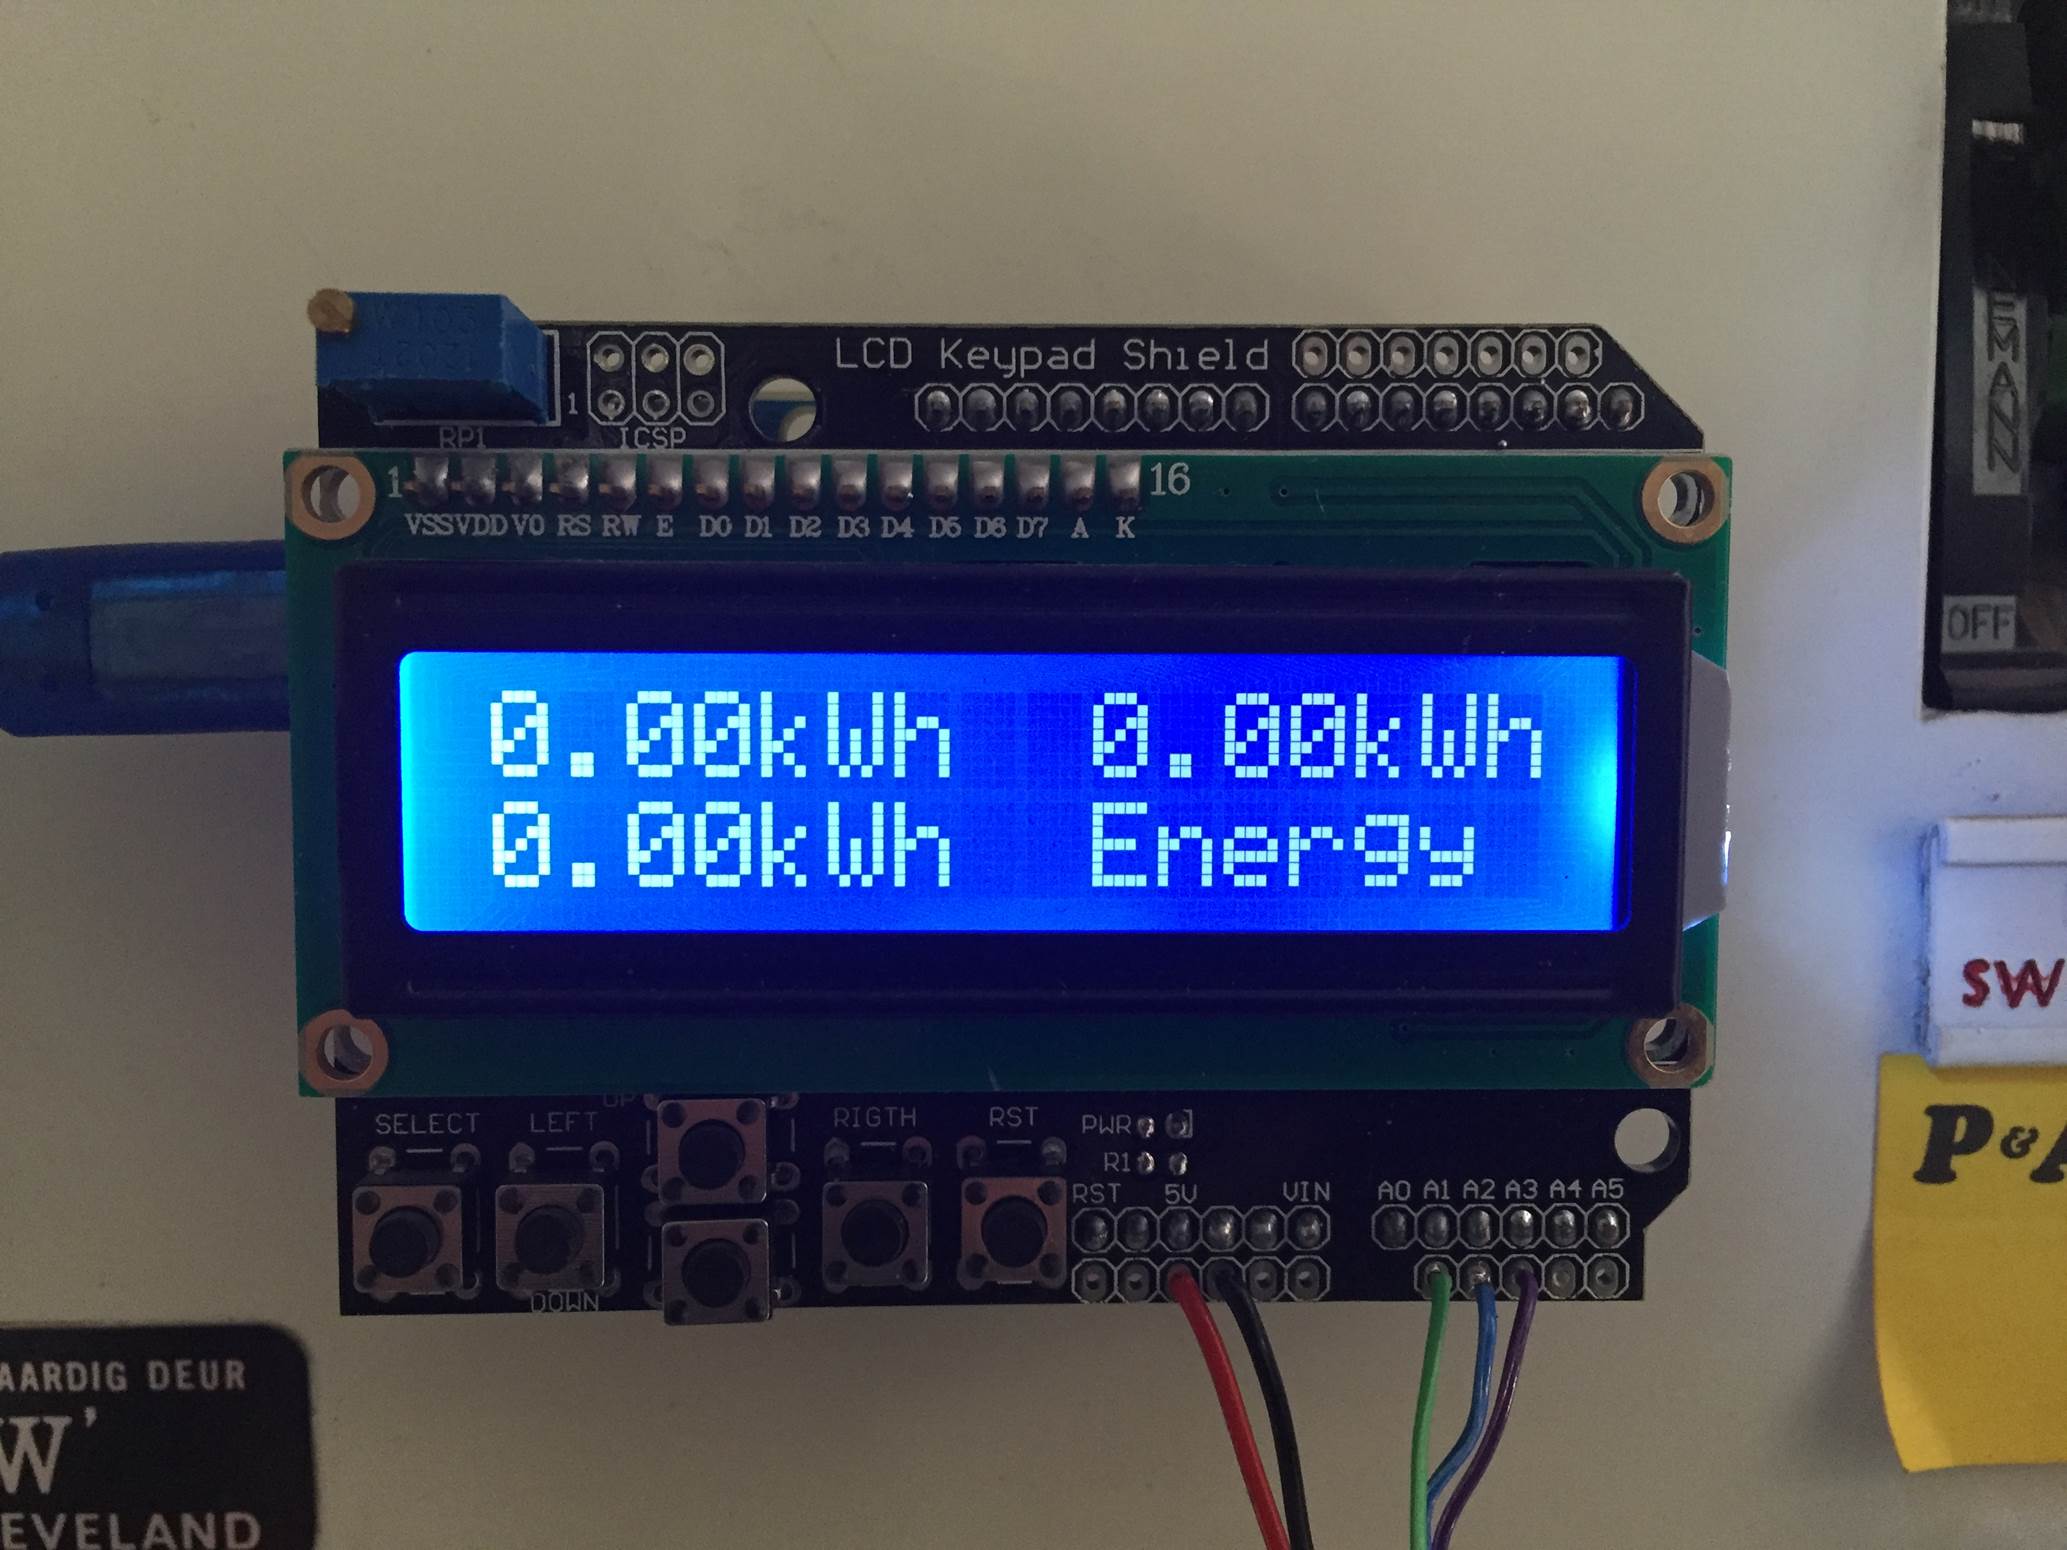
void displayKilowattHours () //Displays all kilowatt hours data
{
lcd.clear();
lcd.setCursor(0,0);
lcd.print(kilos[0]);
lcd.print("kWh");
lcd.setCursor(9,0);
lcd.print(kilos[1]);
lcd.print("kWh");
lcd.setCursor(0,1);
lcd.print(kilos[2]);
lcd.print("kWh");
lcd.setCursor(9,1);
lcd.print("Energy");
}
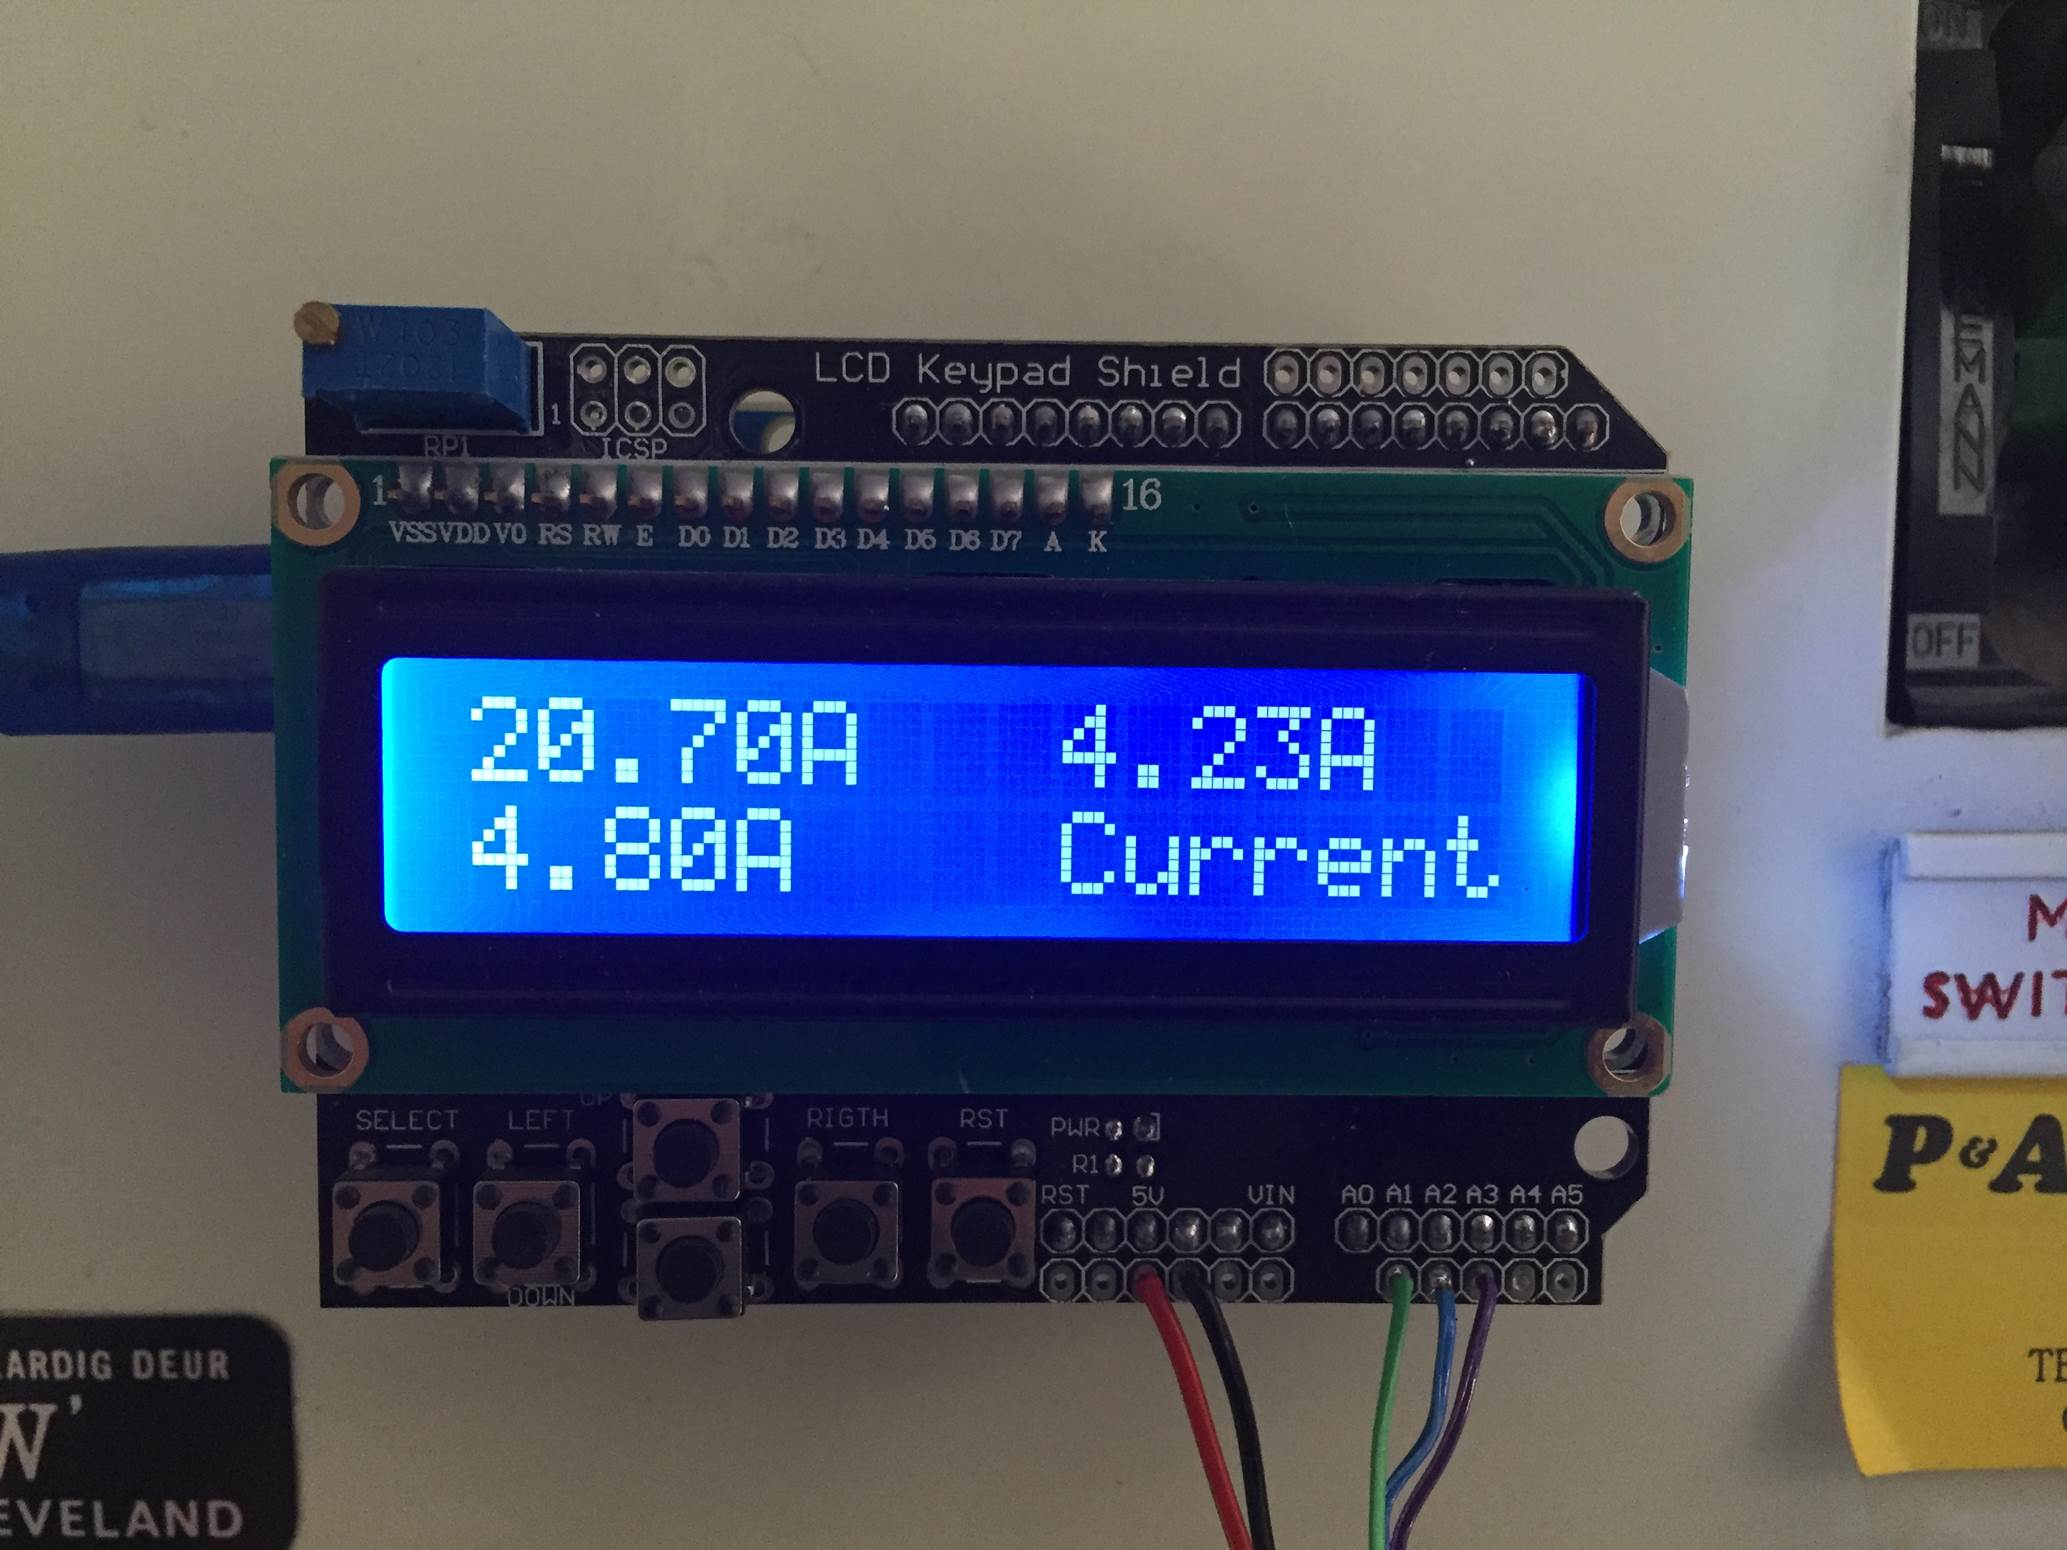
void displayCurrent () //Displays all current data
{
lcd.clear();
lcd.setCursor(0,0);
lcd.print(RMSCurrent[0]);
lcd.print("A");
lcd.setCursor(9,0);
lcd.print(RMSCurrent[1]);
lcd.print("A");
lcd.setCursor(0,1);
lcd.print(RMSCurrent[2]);
lcd.print("A");
lcd.setCursor(9,1);
lcd.print("Current");
}
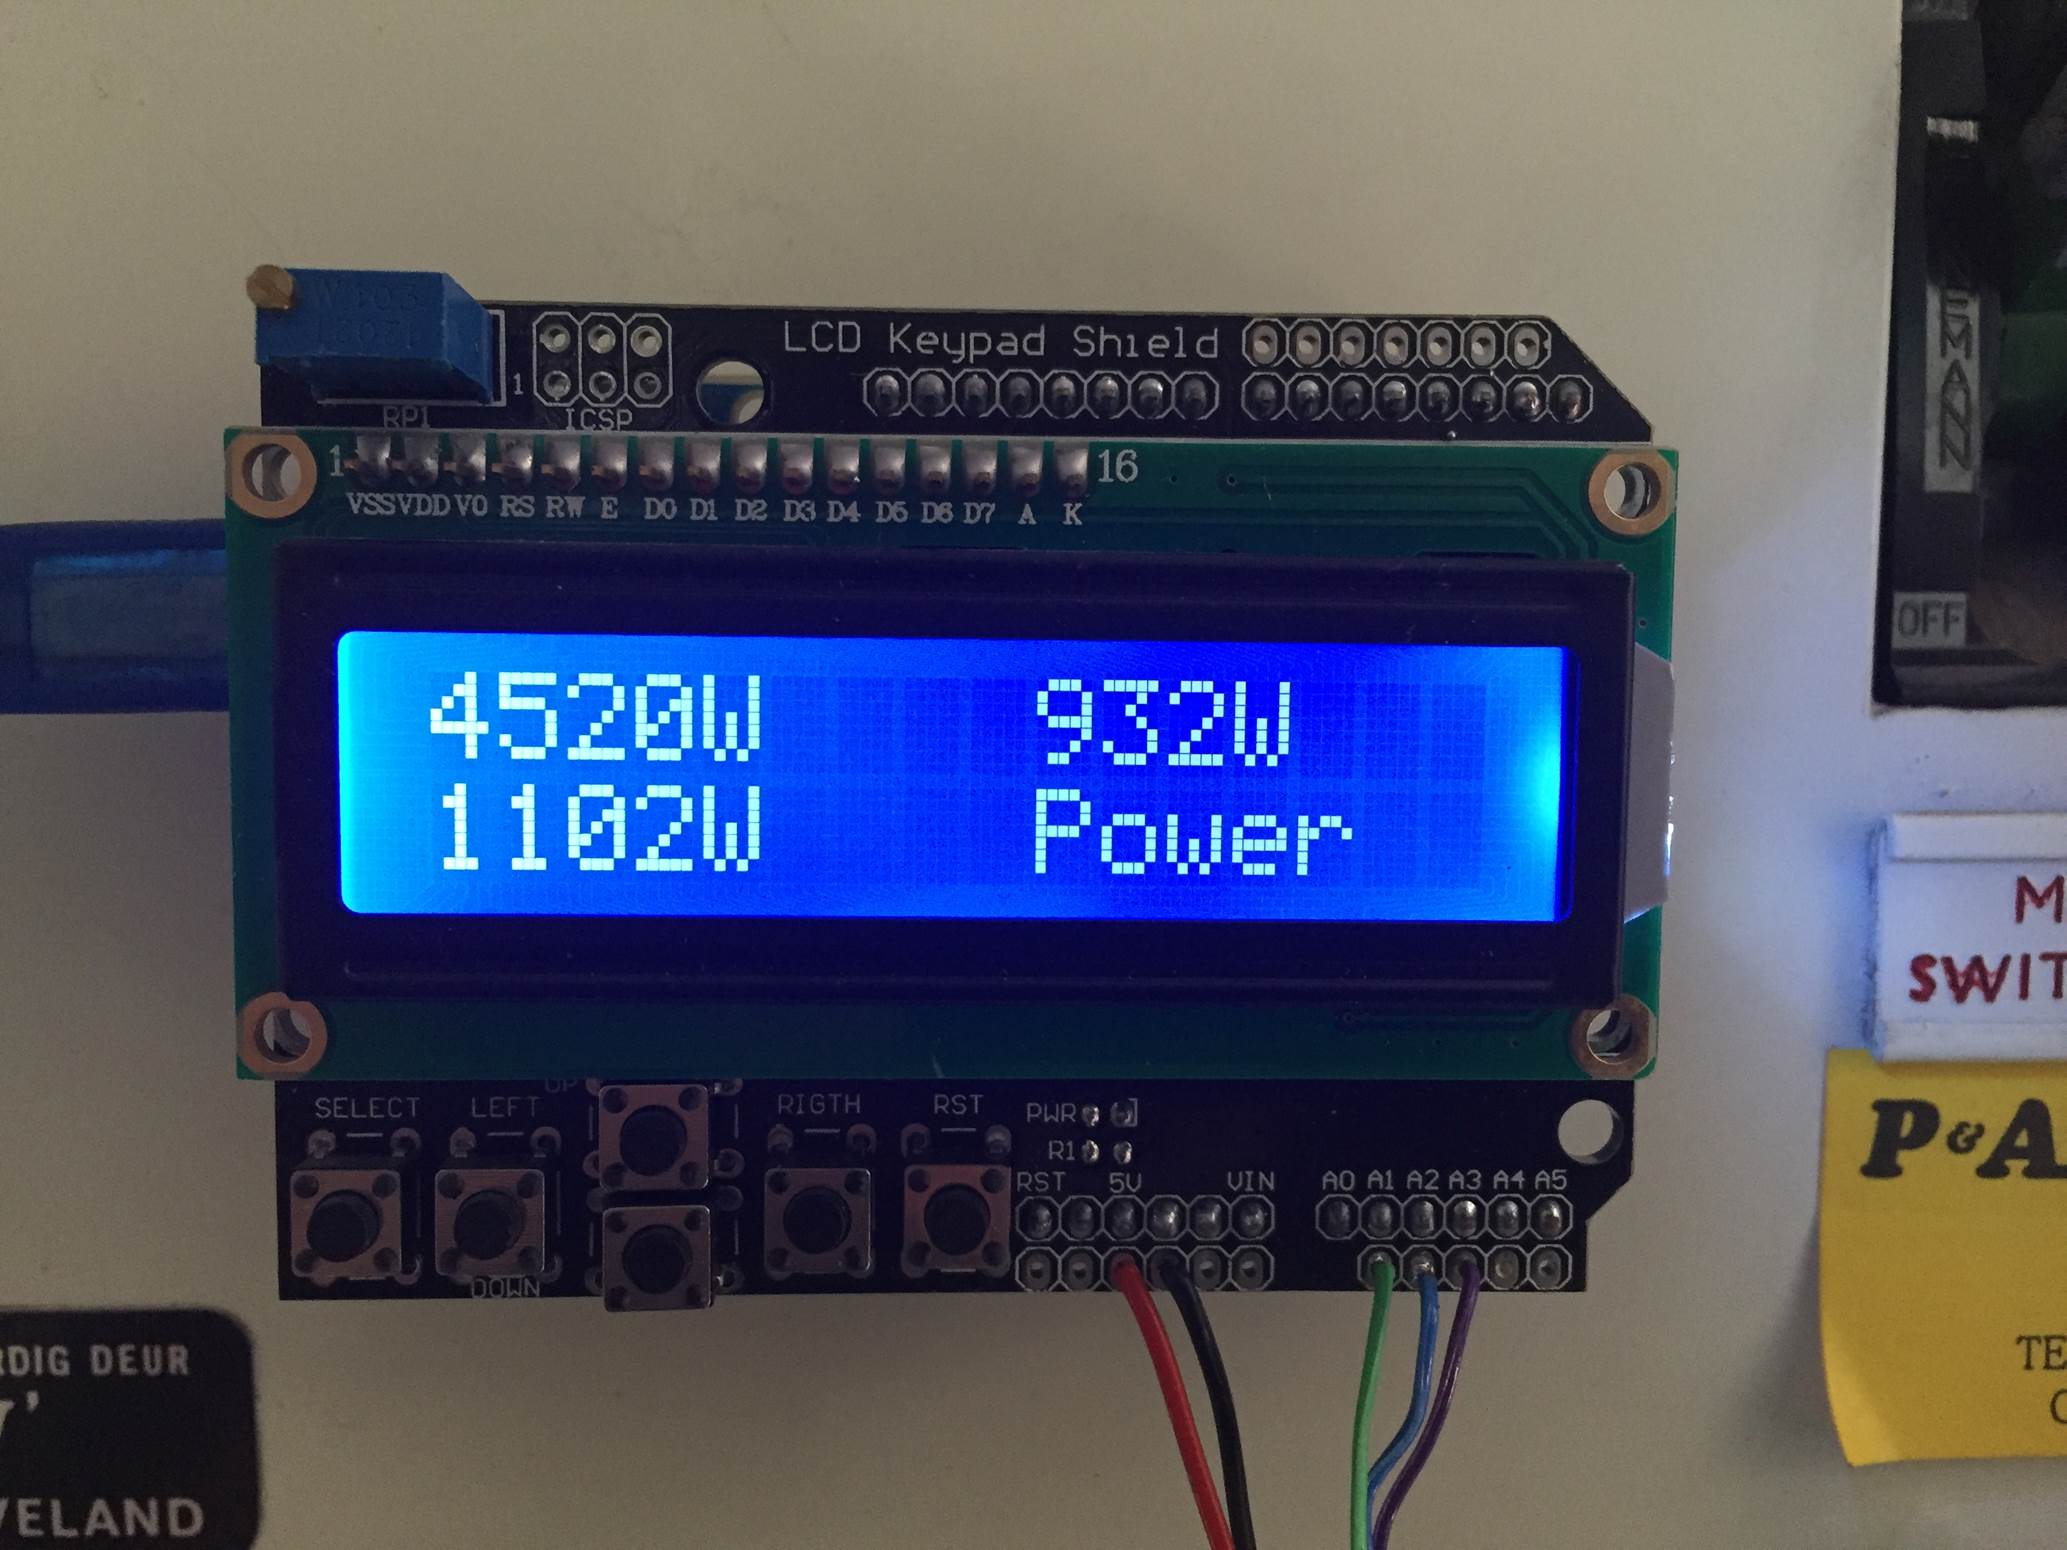
void displayRMSPower () //Displays all RMS power data
{
lcd.clear();
lcd.setCursor(0,0);
lcd.print(RMSPower[0]);
lcd.print("W");
lcd.setCursor(9,0);
lcd.print(RMSPower[1]);
lcd.print("W");
lcd.setCursor(0,1);
lcd.print(RMSPower[2]);
lcd.print("W");
lcd.setCursor(9,1);
lcd.print("Power");
}
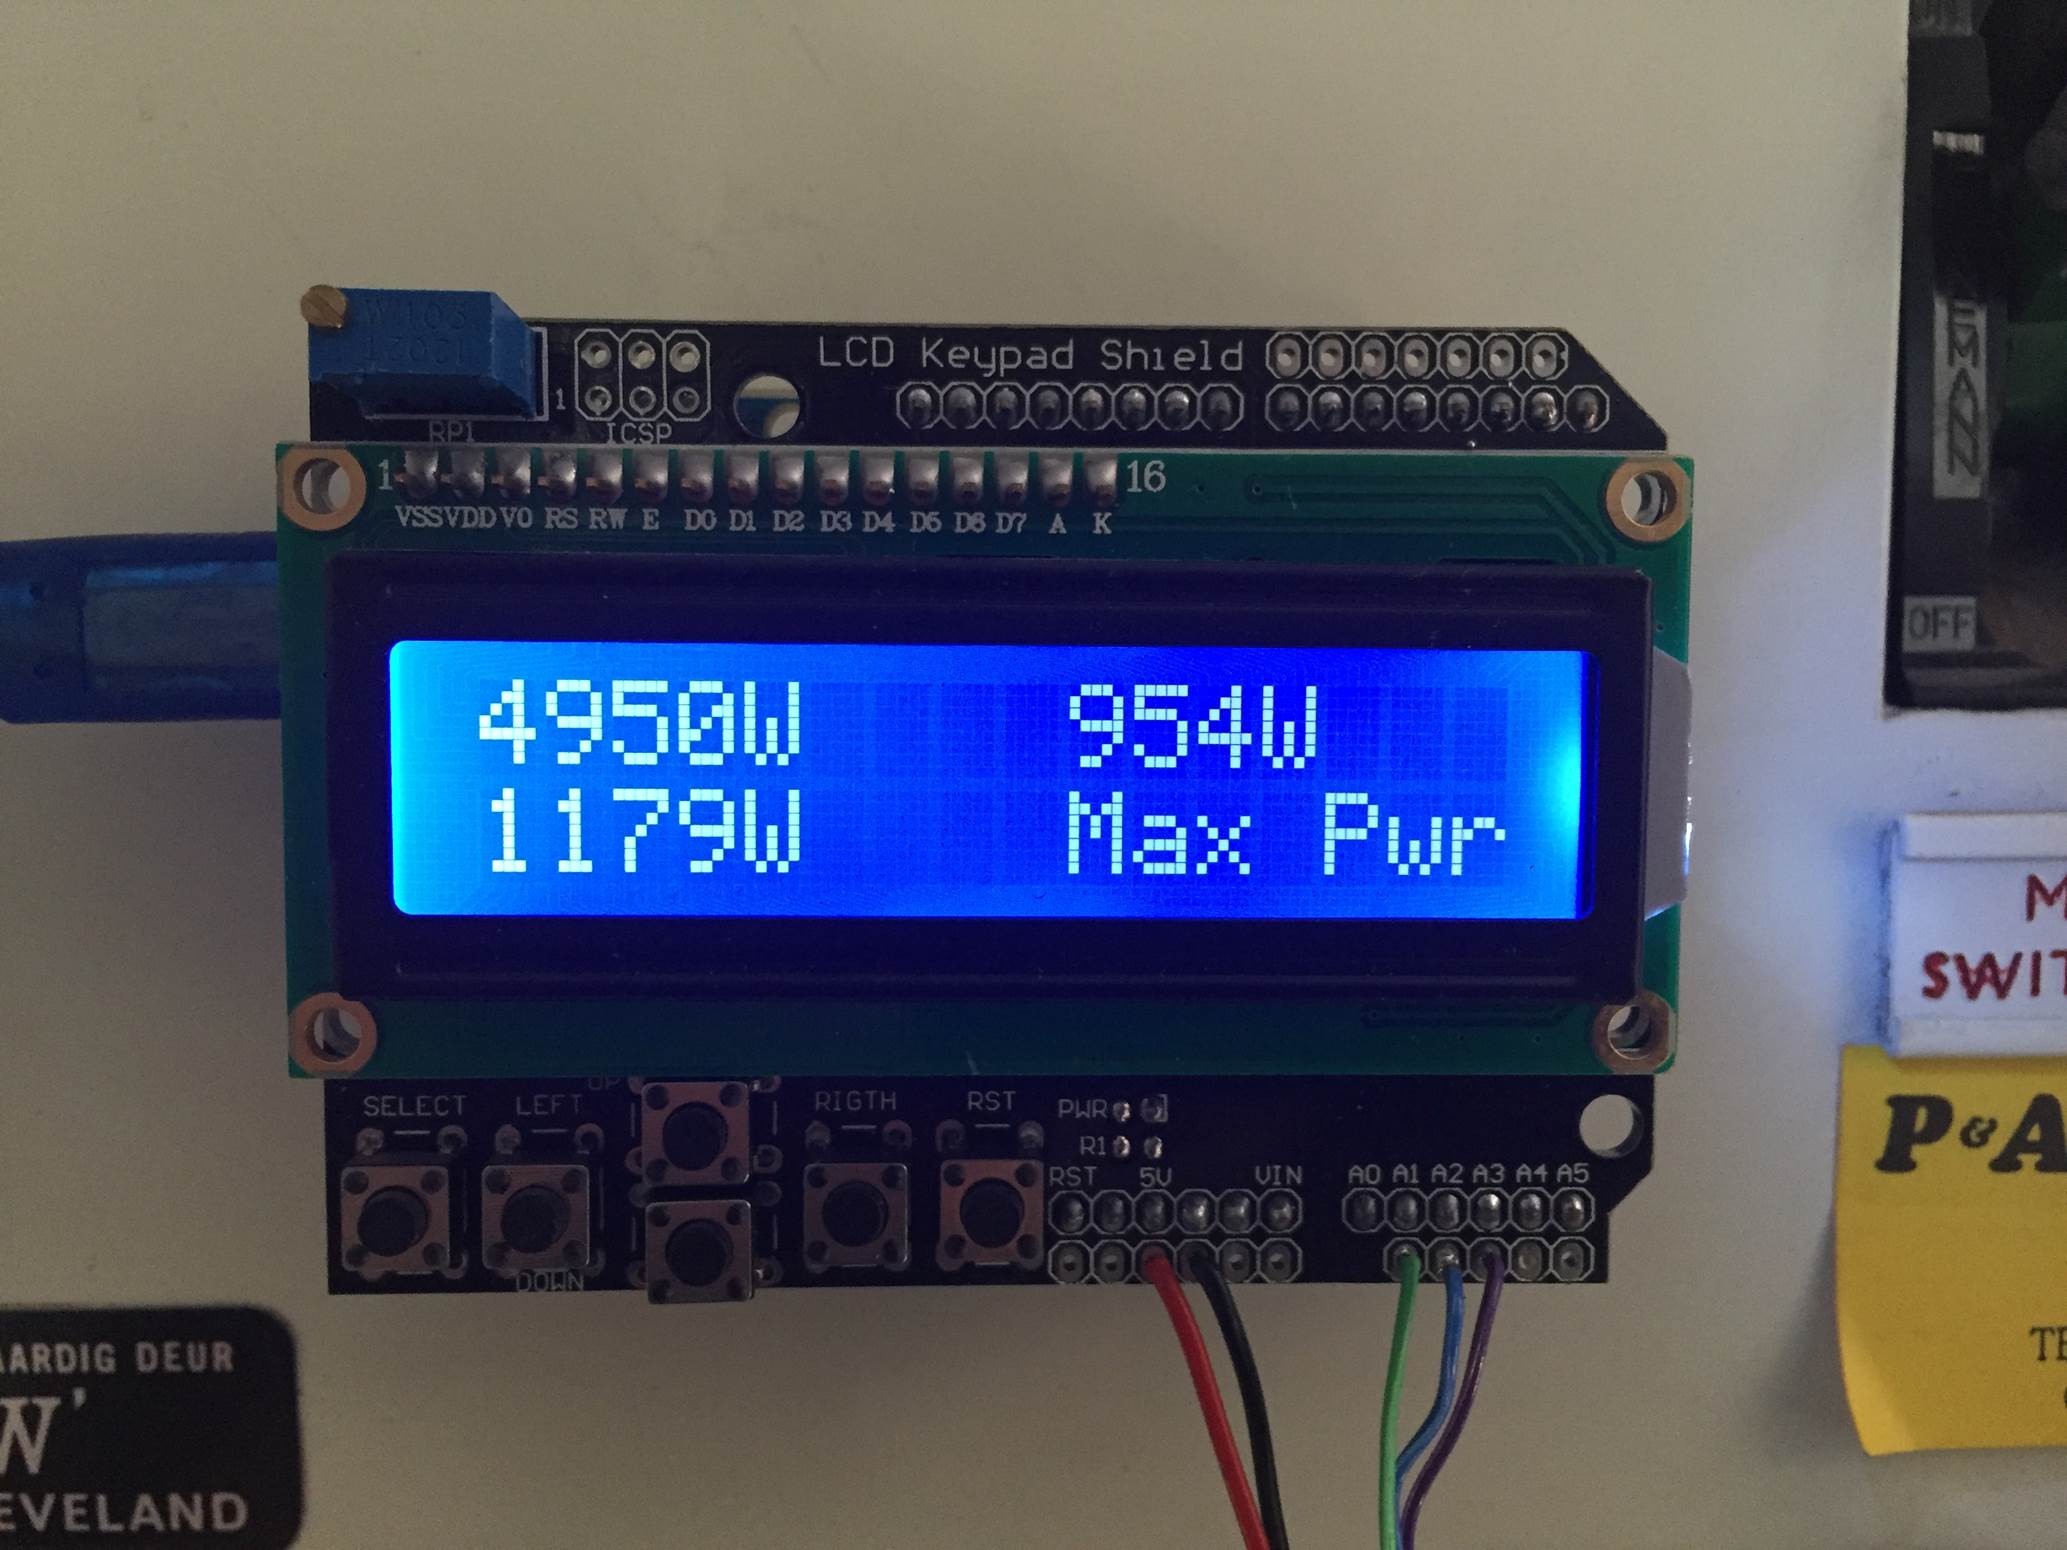
void displayPeakPower () //Displays all peak power data
{
lcd.clear();
lcd.setCursor(0,0);
lcd.print(peakPower[0]);
lcd.print("W");
lcd.setCursor(9,0);
lcd.print(peakPower[1]);
lcd.print("W");
lcd.setCursor(0,1);
lcd.print(peakPower[2]);
lcd.print("W");
lcd.setCursor(9,1);
lcd.print("Max Pwr");
}
Here is the link to download the 3 phase meter code.
Because your setup, CTs , resistors and input voltages may be different, there is a scaling factor in the sketch which you will need to change before you will get accurate results, see below for calibration. If your LCD is connected to the same pins as used here and your CT is connected to the same input pin, you should at least get the screens populated with some figures although these will most likely be incorrect and some may be negative.
This code, unlike our original simple Arduino energy meter’s code makes use of the millis() function to calculate the duration between cycles instead of relying on an estimate, this results in a slightly more accurate (about 0.5%) calculation. For those of you who have read that the millis() function goes into overflow after about 49 days, the code deals with the rollover automatically by making use of the unsigned long variable. For example, if the overflow happens at 10000, the start millis was 9987 and the end millis was 2031, the difference would be 2031-9987=-7956 but the value can’t be negative as it is unsigned so it becomes -7956+10000=2044 which is the correct duration.
Calibrate the Current Reading
As mentioned above, because your setup, CTs , resistors and input voltages may be different, there is a scaling factor in the sketch for each CT which you will need to change before you will get accurate results.
To calibrate your energy meter, your need to be sure that the current that your meter says is being drawn on each phase is what you expect is actually being drawn. In order to do this accurately, you need to find a calibrated load. These are not easy to come by in a normal household so you will need to find something which uses an established and consistent amount of power. I used a couple of incandescent light bulbs and spot lights, these come in a range of sizes and their consumption is fairly close to what is stated on the label, ie a 100W light bulb uses very close to 100W of real power as it is almost entirely a purely resistive load.
Plug in a small light bulb (100W or so) on each phase and see what load is displayed. You will now need to adjust the scaling factors defined in line 8 accordingly:
double calib[3] = {11.8337,11.8234,12.0325}
In this case they were 11.8337 for phase 1, 11.8234 for phase 2 and 12.0325 for phase 3. They may be higher or lower depending on your application. Either use linear scaling to calculate this figure or, if you’re not good with math, play around with different values until the load you have plugged in is shown on the energy meter’s screen.
The Energy Meter In Operation
Once you have you energy meter calibrated and the scaling factors have been uploaded onto the Ardunio, your meter should be ready to connect and leave to monitor your energy consumption.
Upon startup, you’ll see a 3 Phase Energy Meter screen followed by cycling through the current, power, maximum power and kilowatt hours consumed screens. In each case, the top line displays phase 1 and phase 2’s measurements and the bottom line displays phase 3’s measurements.
Current Screen
Power Screen
Maximum Power Screen
Energy Consumption Screen
Video Of The Energy Meter In Operation
How did this project go for you? What have you used it to monitor? If you have any questions or would like to share your build of this three-phase energy meter, please post a comment below or send a mail using the contact form.
Hey there
This is great was a bit busy but i made the 3 phase circuit in the meantime and put together some code
just waiting for some stock to put everything in a case then i will mail you pics of the setup i made
Thanks 🙂
Great! Looking forward to seeing some of your pictures.
Pc
Cool project. I never realized how simple measuring 3-phase could actually be. I thought it would involve more complex math, dealing with the phase angle. Learned something here.
I’m just a little confused by this line:
if (maxCurrent = 517?
Hi Michael,
Thank you. It really can be made quite simple, there are two things which typically complicate it, one is when your supply is three wire three phase (this setup and code require the neutral) and the second is if you have very inductive or capacitive loads (low power factor). Since most household wouldn’t have too many low power factor contributors, the meter works quite accurately.
The line you are referring to is defining the “zero” current line of the AC waveform. The Arduino analogue input ideally maps the AC current sine waveform from 0 – 1024 with the mid point at 512. Practically, the middle of the waveform is occurring very slightly higher at 516. The code is simply saying that any readings below 516 are negative and should be discarded.
Hope this helps and I have explained it clearly enough.
Will it be accurate for inductive loads?
It depends on how inductive. The further from unity the power factor of the inductive load is, the less accurate it is going to be. You need to measure the voltage as well to make an accurate inductive and capacitive load meter.
Hey!
Nice work 😀 Always fun when something like this can be put together.
A couple of notes based on my experience!
1. Safety. When using a CT like this – even with a high turn ratio (not high turn ratio CT’s are safer than low turn ratios) with an open circuit the CT becomes a voltage source – meaning a high and dangerous voltage can be present! Always make sure the burden resistor is soldered to the CT leads, preferably as close to the CT as possible. This can be done very easily by stripping some of the wires away, soldering the burden resistor in and some heat shrink over the whole lot. Also choose 1% or better tolerance burden resistors AND make sure the wattage is applicable to the CT!
2. The sketch. It doesn’t seem that the correct RMS calculation is being done, plus there is math going on in the sampling – meaning that the current waveform being sampled may not be fast enough… With the SEGmeter codes I have developed, I have an array that I sample into, meaning the sampling can be as fast as possible. I can get around 4kHz sampling using the 16Mhz arduino. Adding math here slows this considerably!
Simply how this should be done is:
– fill up the sample array for the desired number of samples.
– square each sample
– add the squared sample into an accumulator variable
– when done, divide this accumulator variable by the number of samples
– calculate the root from the result of the division
– apply the calibration factor to this result
– do other maths for energy based on time etc
The sketch for Arduino based ADC is used in the SEGmeter V1 is below
https://github.com/samotage/Aiko/blob/master/SEGmeter/seg_meter_v0_199.pde
Note, the V2 SEGmeter uses a separate 12 bit ADC over SPI.
Another thing for Arduino and this kind of stuff, which is useful for current sensor selection, is that many sensors have a 0.333V output. Setting the Arduino analog reference to INTERNAL, means that it uses the internal 1.1V as it’s ADC vRef – a handy hint I got from @jonoxer once upon a time
analogReference(INTERNAL);
There is a bunch of other stuff I can share, and hit me up if you would like any more tips!
Sam, @samotage
Hi, just wanted to tell you, I enjoyed this post. It was inspiring. Keep on posting!
Hi
its been a while and I eventually got the 3 phase up and working but regarding some fine tuning i just want to check some things in the code if you would explain it to me
” if (maxCurrent <= 517) <— where does this 517 come from?
{
maxCurrent = 516; <—- same here
}
RMSCurrent[i] = ((maxCurrent – 516)*0.707)/calib[i]; //Calculates RMS current based on maximum value and scales according to calibration
RMSPower[i] = 220*RMSCurrent[i]; <—— if it is 3 phase should this not be like 400
I have got the box built and hooked it up to emoncms so i get pretty nice graphs and the bells and whistles .. its just as soon as i check on the "lives" of the 3 phase i get about a 6 amps difference
We are actually measuring a cold rooms compressor
Thanks again
I change the setup a little bit, now im using 4×20 serial display and i also can see the data via a webserver.
I tested the setup with 3 lamps on a 3ph net and it worked great.
But when i place it in my main electric case i always give the same current and power readings.
What could be the problem?
Hi Filip,
That sounds interesting, would you be willing to share your webserver setup and code?
What do you mean by the same current and power readings. Are they not changing or are all three giving the same reading? Are the readings staying the same as when the lamps were connected?
Hello,
How can i send you the code?
When i do a test setup everythings works great i have different reading for power and current dependent on the load i use on one of the 3 phases.
But when i instal everything in the electric cabinet the readings are wrong.
I try to figure out what the problem is.
You can email the code and any photos you have through to admin(at)the-diy-life.com and we’ll have a look at posting your project, with credit to you of course.
Is your setup a 3 or 4 wire three phase installation? This code will only work for a 4 wire installation where all phases are referenced to the neutral phase. One 3 wire installations, the voltage and current run phase to phase which means that some of the power being measured is being cancelled out by the return path through the phase. You’ll get very low incorrect readings with this code on a 3 wire three phase system.
Hello Filip Ledoux!
Would you be willing to share the code?
email me please 🙂
[email protected]
Thanks!
mam otazku dalo by sa merat s týmto meracom aj smer toku prúdu napr. ci je spotreba prúdu alebo dodávka prúdu asmozrejme po uprave kodu
Ahoj Fricosk,
Zdá sa, že existuje problém s prekladom, nie som si celkom istý, čo sa pokúšate opýtať. Skúste to preformulovať a skúsim vám odpovedať.
Hi meassure is not good, because, there is problem with voltage.. some times 210 some times 239 .. then is a lot of difference….
Is it possible made input voltage and calculate with this?
Then it will be more precision.
Hi Mario,
Yes if your voltage is constantly changing then you’re going to get inaccurate results. You’ll have to install a step down transformer to around 3V for the Arduino to read the voltage.
Hi!
My supply voltage is also changing, can you teach me how to install the step down transformer sir to read the accurate voltage?
Thanks !
Please email me 🙂
[email protected]
Would it be difficult to modify the sketch to only measure 2 inputs, and then add both inputs to display the total on lcd or serial monitor?
Hi Steven,
It’s really easy to modify the code to measure 2 inputs as the inputs are stored in an array. Simply run the array from 0-1 instead of 0-2. Add a line to sum up the array values in position 0 and 1. Most of the work will be in modifying the display code to suite your application but you’ll only be working with the summed results and not the array elements.
Good luck!
good greeting
How can I apply items without LCD Shield
Just using LCD Screen 16*2
Hi Ahmad,
Here is a guide to connecting an LCD screen without the shield: https://www.the-diy-life.com/connect-an-lcd-screen-to-an-arduino/
Can I get meeter data on serial port.
Hi Indrasen,
Yes you can, have a look at our post on the Simple Arduino Energy Meter for coding to the serial monitor.
Great Post. Thanks.
Is there a reason you connect the burden resistor and the current transformer to the high side of the voltage divider (that creates the 2.5V reference)
The current transformers have two wires: +ve and -ve side. I would like to connect all the -ve sides together and tie those to ground. Then connect the +ve sides to adc1, adc2 and adc3 (with burder resistors on each). Would that work?
Thanks.
Hi Abid,
Thanks for the great feedback. Yes, we connect it to the high side of the voltage divider so that the current sine wave’s midpoint is elevated to 2.5V. This means that the peaks of the sine wave are between 0V and 5V. If you connect them directly to the Arudino inputs then you’ll have a voltage input onto the Arduino’s analogue inputs which fluctuates positive and negative and you don’t want to be putting a negative voltage onto the Arduino’s inputs, it doesn’t handle this well.
Hope that helps.
Thanks for the feedback. Makes sense. I didn’t realize the voltage values from the CT would be negative.
What size wires did you use for the CTs?
Hi Jayd,
It is about 0.5 mm / 25 gauge wire. There isn’t really any current flowing through the wire as all of the components are mounted directly onto my CT.
The regular Arduino jumper wires should suffice?
Yes, they’re perfect.
The jumper wires that comes with the arduino kit should suffice ?
The highest current I’ll be measuring would be around 50A or 50ma
Thanks for your help
Hi would you be able to tell me the best way to get this connected to wifi? I was about to purchase an Arduino Uno Wifi board but it seems they are no longer making them. So far I’ve thought of two options: 1. Connect a esp8266 module to an Arduino Uno. 2. Connect a analog board to a nodeMCU. I’d rather keep it to one board
Hi Mitch,
It depends what you’d like to do with the WiFi but I think your first option (connecting the ESP8266) would be the easiest. There are a few free IO pins which should allow you to connect the WiFi module in conjunction with the LCD shield (if required). I’m not aware of any specific shields designed for the Arduino Uno which provide WiFi connectivity. The other option would be to use an Ethernet shield and then plug in an Ethernet to WiFi adapter.
hey there. is this porject using dc or ac energy meter? If it for DC energy meter, can i ask your help for AC energy meter porject? I want to know the different DC energy meter and AC energy meter
Hi Muhammad,
This is an AC energy meter. They essentially operate in a similar way (they measure current and often voltage to calculate energy usage) however you will need different sensors to measure the current usage in AC and DC applications and the way in which the data is processed to give you your energy consumption will be different.
Dear Michael, thank you very much for sharing these plans. Can you tell me what would happen if a solar inverter is feeding its current into one of the phases? Would the resulting current of this phase be displayed as negative?
Hi Tobias,
I am not sure how your load, feeder and energy meter would be configured. If your load and grid tied solar inverter are both on one side of the CT and your main electrical connection is on the other side then if there is less load then what the inverter can produce then you could get a negative current reading. The code however won’t allow for a negative energy measurement, it will just be ignored.
Dear Michael, that is what I believed to have deducted from the code. Thank you very much for clarifying!
Dear Michael,
It was quite gud to do and was very simple to implement . But the readings of current I got r much more higher than the actual current value. Can I know what changes can be made to get the exact values of that?
Hi Harshini,
You need to go through the calibration process and adjust the code to get the correct current reading and this will carry through to your kWh recordings as well.
hi,
the images for connecting to the CT aren’t clear. in the tech spec’s the CT has a 3.5″ audio plug and according to the spec’s, they are output on the tip and near the plug. How exactly do you feed the signal to the arduino?
thanks
Hi Carlos,
You do not connect the CT straight to the Arduino, you need to connect it as shown in the circuit diagram with the resistors and capacitors to create an input circuit. The CT is the black symbol labelled CT and is connected to the yellow and purple wires.
Hello,
thx for the post, my question is, how can I do to have also “negative” power as indeed I have photovoltaic panels and I want to now when I send power outside… Is it also possible to add only 1 transfo to mesure the voltage? (and then calculate the real power with emonlib ?)
If it’s not clear let me know…
thx
didier
Hi Michael,
Thank you for your very nice article.
In “Sizing The Burden Resistor” section you mention:
“This article worked on 42A with…”
I do not understand where this “42A” comes from.
Can you please explain ?
Best regards
Emmanuel
Hi Emmanuel,
The CT used has a nominal sensing range of 30A (meaning it can continually sense 30A without overheating) and a maximum of 75A (for short periods of time). So for scaling the CT output to suite your Arduino’s analogue input voltage, you need to select a maximum current you’d like your energy meter to sense which should be between this range. The higher your maximum current, the high the power your meter can sense but the lower your resolution and accuracy will be for smaller currents. I chose 42A to allow for some margin on the 30A nominal but without going too high that if affects my meter’s resolution when measuring lower power devices.
Thanks for your reply Michael,
Your answer clarifies the issue.
As for the resolution and accuracy of the meter, I am planning to use a 16bit ADC which will increase the resolution of the analog port from 1024 to 65536.
That means that for 30Amps/220V, the Watt resolution would be 0,1W instead of 6,5W of the Arduino’s 10bit ADC.
For that purpose I am going to attach an Adafruit ADS1115 16bit ADC which allows to connect all the three CTs at the same time.
Hi Emmanuel,
That sounds like a great addition to the project. Just something to keep in mind; if you’re going to the trouble to increase the accuracy of the measurement to that degree then you’ll probably want to look into measuring the voltage using a small transformer to convert your supply voltage down to 5V. This will enable you to measure true power rather than apparent power and should also improve the accuracy of your meter.
If you’d like to share some photos once you’re done, I’d like to add them to the end of the project for others to get some ideas?
Hi Michael,
That’s exactly what I had in mind. For that purpose I already ordered a ZMPT101B AC voltage sensor.
When every component arrives, I will start the project.
If the project succeeds I will send you some pictures and comments.
Sounds great, I look forward to seeing your finished project!
Hi Michael,
Good to see you are still answering questions 3 years after posting this article, I have one for you also! Is it necessary to have 3 individual voltage dividers? Why not just have a single divider to provide a 2.5V reference to all CTs?
Hi Adam,
I haven’t really looked at that to be honest, I simply copied the circuit used in the single phase meter. I don’t see any reason why you wouldn’t be able to use the same voltage divider for all 3 CTs. It would certainly make the circuit simpler.
Hi Michael, I am building a small wind project, where I am using a 3 phase 2kW wind turbine. I wanted to measure the output from the wind turbine itself which is not an true RMS, the rated frequency of the wind turbine is 32Hz. Does the energy meter you built measure voltage, current, power and energy for this wind turbine?
Also, in your energy meter can you show cumulative values of the parameters of all the 3 phases as a single value of power and energy?
Thank you
Hi Dave,
I think you’re going to need something quite a bit more complicated than this. This is a simple meter which makes a number of assumptions which are not true for your application.
You’ll need to build a meter which measures and logs both the voltage and current produced in order to accurately estimate power and energy produced. You could use a lot of the concepts used in this project to do so, but you’d definitely need to take it quite a bit more in depth.
Good luck, sounds like an awesome project to try!
Hi Michael,
The energy meter I build stops measuring above 16.91Amps at 230Vac, it is accurate to that point. I have drawn more current for testing but it’s just that, max 16.91Amps. Can’t explain it myself maybe you have an idea. these are my specific components I have used
talema AS-105 750:1
75Ohm resistor
this is the calculation
talema AS-105 750:1
25Amps 25/750=0.033Amp =33milliAmp
2.5V/0.033=75Ohm – 1/4W
Hope you can find the time to shed some light.
Kind regards, Friederik
Hi Friederik,
Your calculations and components look correct. How have you connected them? Make sure you’re not putting more than 5V onto the Arduino’s analogue input. An perhaps test the voltage on the analogue input and check that it continues to increase when the input current goes beyond 16.91 amps.
Hi Michael,
first off all maybe my measuring points are wrong, but when I measure between the analogue inputs on the arduino uno and as negative the – wire that supplies the CT sensor I measure always 2.47volts +/-0.10. Doesn’t matter if i draw 1amps or 16amps.
Hi Michael,
Today i hooked up the oscilloscope and found that there is a dc signal on the analogue lines which amplitude grows with higher AC current. With same current it’s repeating identical every 20millisec (230ac -50hz) It seems that the 16,91 amps corresponds with a 5volt amplitude (but it’s only there for a short while, I geuss this is why the multimeter reads 2.5V all the time. Any suggestions? If i had the room I’d used the same comonents to copy your setup but I have restricted space for the CT’s
Kind regards, Friederik.
Hi Friederik,
This is correct, the circuit and CT will convert the current sine wave into a scaled voltage sine wave between 0 and 5V, which is then read in by the Arduino. The amplitude of this wave should vary with 2.5V being 0 amps and 5V being the maximum you’ve calculated and sized your burden resistor for. So you should see a change in amplitude if the CT is sensing more current. It depends on your multimeter and what setting you’ve got it on. It likely won’t respond to 50Hz when measuring DC voltage, you’ll need an AC voltage measurement.
Dear Michael,
Searched some more and will start the build from scratch as the issue is resolved. This link was very helpfull:
https://learn.openenergymonitor.org/electricity-monitoring/ct-sensors/interface-with-arduino?redirected=true
As it takes into account peak to peak amps not RMS values which makes
16.91amps x1.414=almost 25Amps
30ampsx1.414=42Maps as used in the example
So anybody using their own components and isn’t at home in this field, use the link it will guide you home.
Kind regards, Friederik
Hello Michael,
Very interesting post!, I need to monitor hourly consumptions on a 3 phase grid over a few months. Is this set up abble to store data? or could it be connected to a datalogger?
Best regards
Federico C.
Hi Federico,
Yes, you could either connect a data logger through SPI or I2C or simply connect an SD card reader/writer to the Arduino and have it write the data to a CSV file.
c genial et merci beaucoup de m’aider ,mais j’ai l’oportunite a props ce projet de metre en oueuvre les information dans une aplication mobile a le but de diminuer la cosomation de mison par alerte cosomation dans chaque heure et donner des solution pour le diminuer
Hi Michael,
I’ve modified this setup to read only amps on a 3phase motor that goes clockwise and counter clockwise. When I test the motor in one direction the amperage reads fine. When I change the direction the arduino freaks out and there is a bunch of weird symbols on the LCD. I change the rotation of the motor with a switch that is located before the current sensor that switches 2 phases.