Today we’re going to be looking at using the Arduino Oplà IoT kit to make your own weather station which posts data to the cloud, which you can view on a dashboard on your computer, phone or tablet from anywhere in the world.
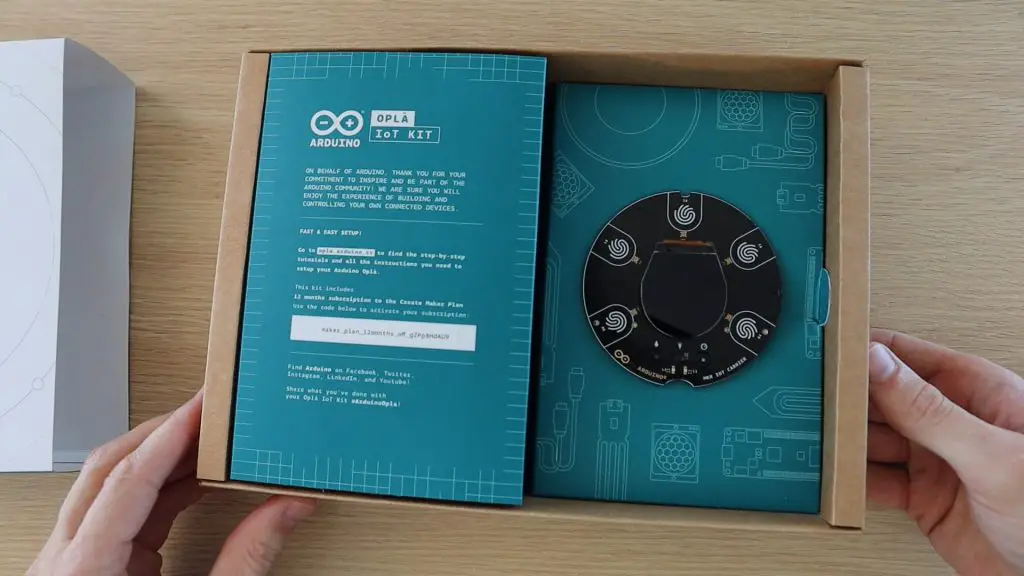
Towards the end of last year, Arduino launched their Oplà IoT kit. I did an unboxing and first impressions post which is linked here. I played around with programming the Arduino locally and using it to fetch information from the internet, but I didn’t get to try the Arduino IoT Cloud. So today we’re going to do just that.
Here’s a video of the build, read on for the full write-up:
What You Need To Build Your IoT Weather Station
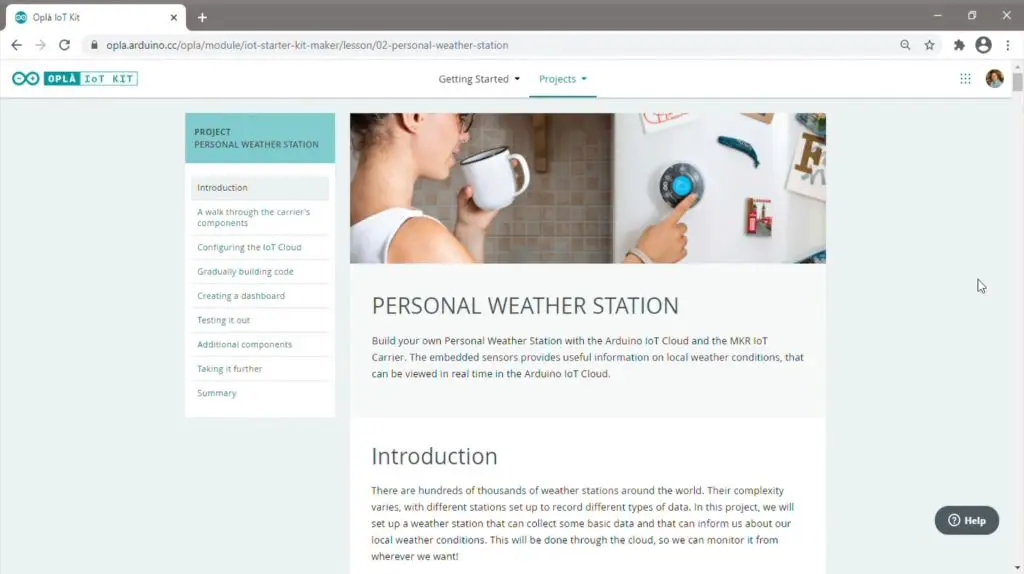
This project is primarily based on the Personal Weather Station project which is included in the kit, but we’ll also be making some improvements and enhancements to get a bit more out of it.
So we’ll just be using the components which are included in the Arduino Oplà IoT kit, you can get here:
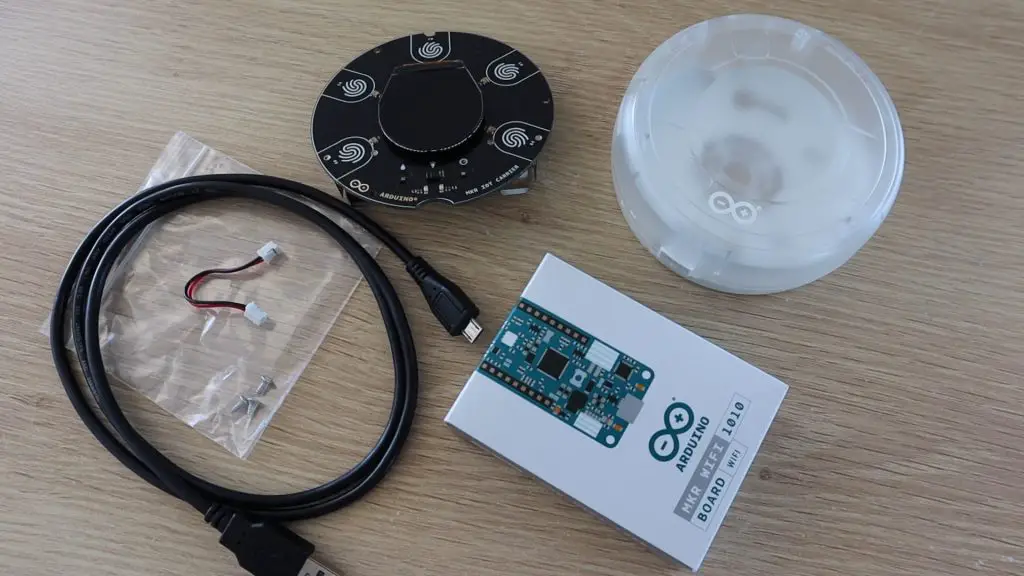
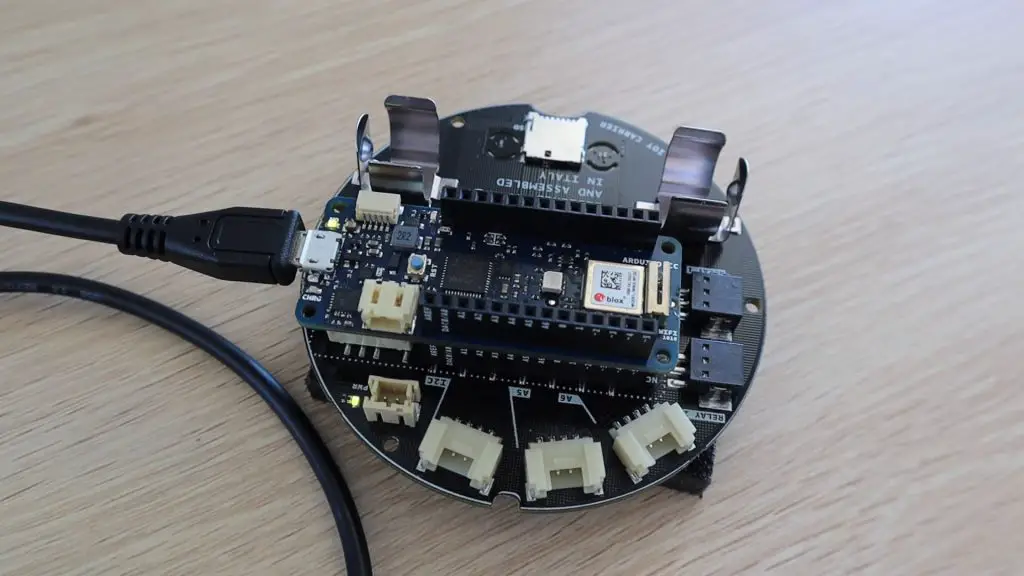
For this project, we’re going to be using the IoT Carrier board, the Arduino MKR1010 board, the plastic case and then the power cable, USB cable and three included screws.
Building The Weather Station
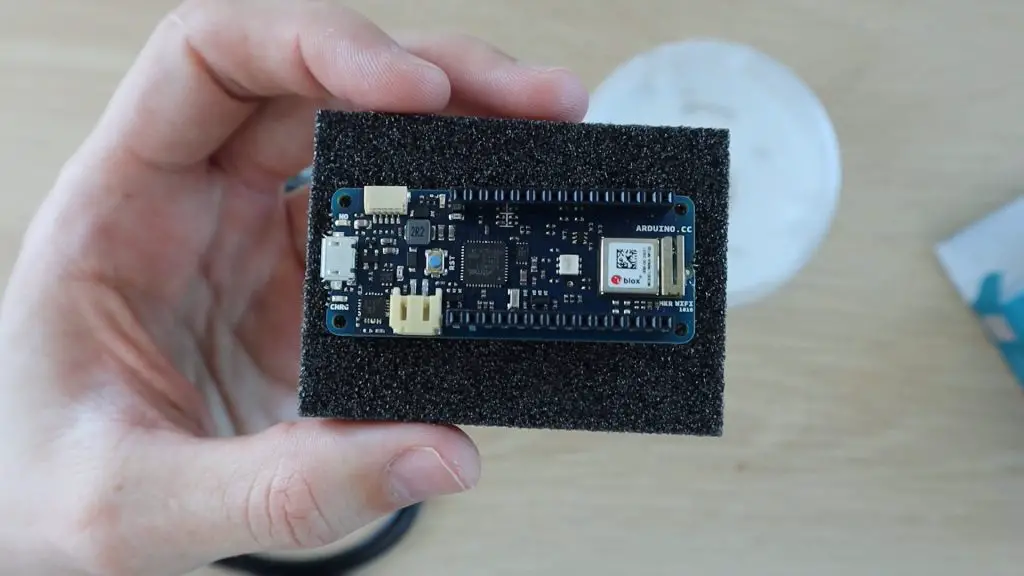
The Arduino used in the IoT kit is the MKR1010 board, with onboard WiFi and Bluetooth connectivity. It plugs into the carrier board, takes readings from the sensors and then posts these to the cloud using its WiFi connection.
To get started, we’ll follow the project guide on the Oplà site.
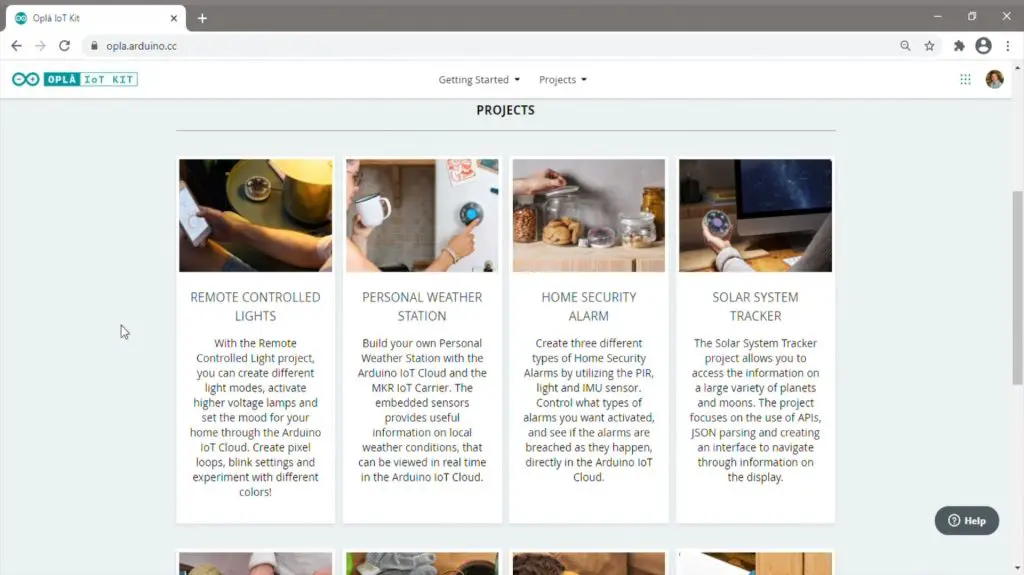
As you can see, there are 8 included projects, we’re going to be running through the Personal Weather Station project.
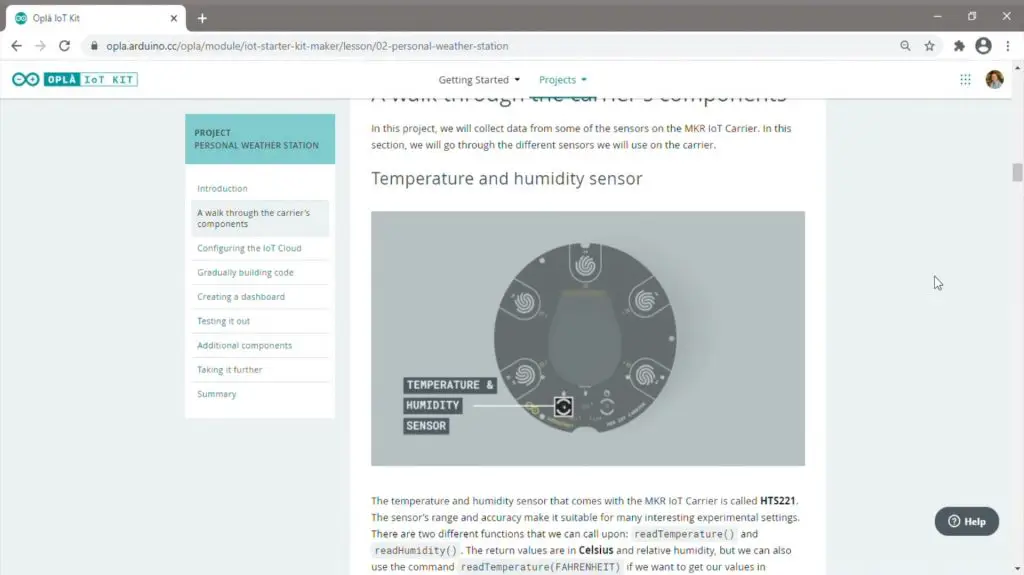
We’re going to be using the temperature and humidity sensor, the pressure sensor and the light sensor, which are all positioned at the bottom on the front of the carrier board. So we don’t need to add any external sensors or do any wiring.
Setting Our Arduino Up As An IoT Cloud Device
To start off, we need to set our Arduino MKR1010 board up as an IoT cloud device.
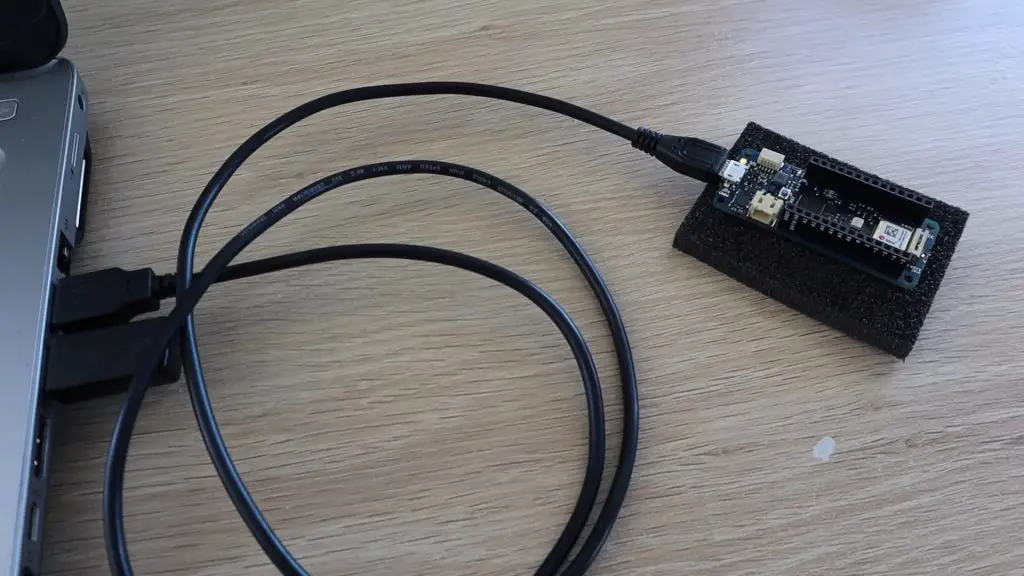
To do this, we need to plug it into our computer and install the Arduino create plugin. This is a small plugin which runs in your system tray and allows the web interface to talk to the board. Once you’ve downloaded and installed the plugin, check that it is running in your system tray. If not, you’ll need to search for it and run it.
We then go across to devices on the IoT cloud page and set up an Arduino device.
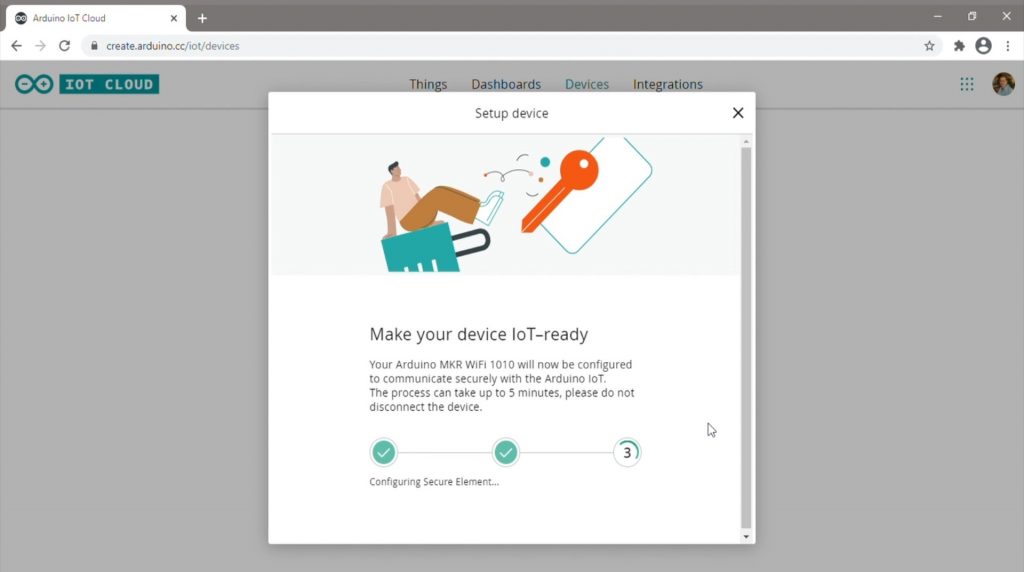
This process is fairly well automated, it first detects your board, then uploads a generic sketch to the device which enables it to connect to the IoT cloud and be seen as an IoT device. It lastly runs through a verification process to test that it is working correctly.
Creating Our Weather Station “Thing”
Once we have our device set up, we can start creating our first “thing”, which will be our Weather Station.
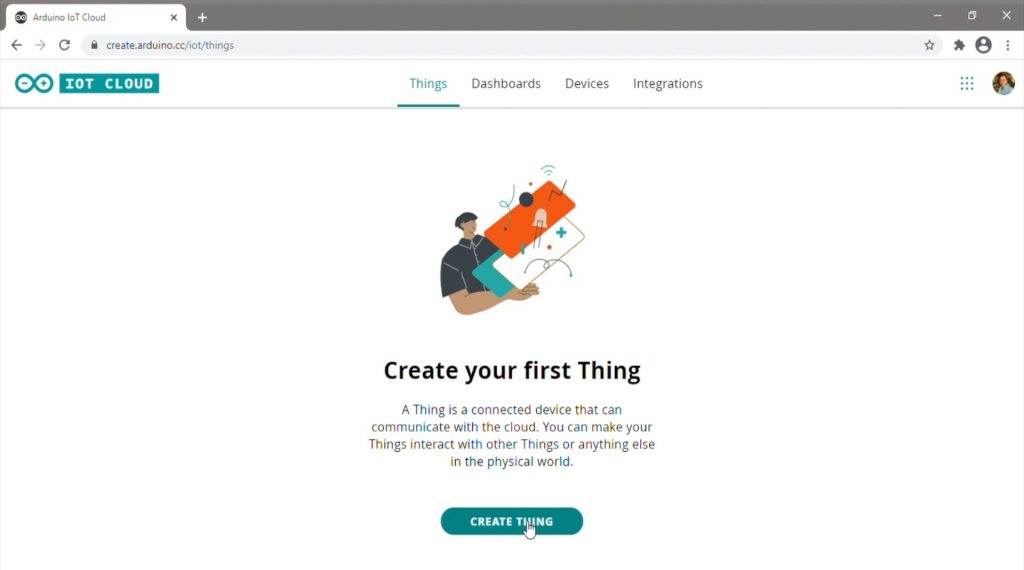
Thing’s are basically cloud-based applications which you can create using the Arduino IoT cloud platform – each project you create, which uses it’s own Arduino, is a new Thing.
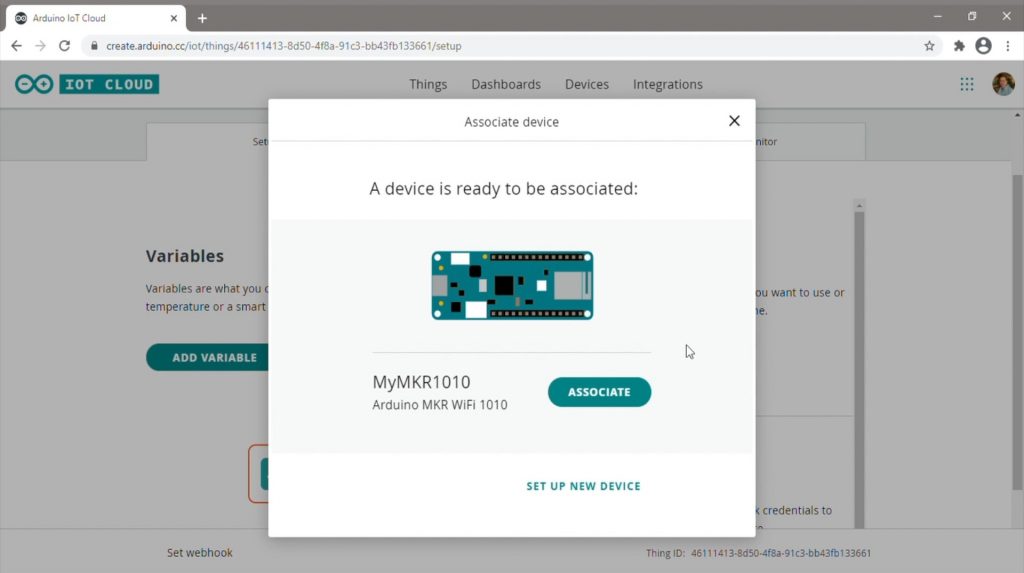
When you first create a thing, you’ll need to assign a device to it, which will be our MKR1010 board which we set up previously.
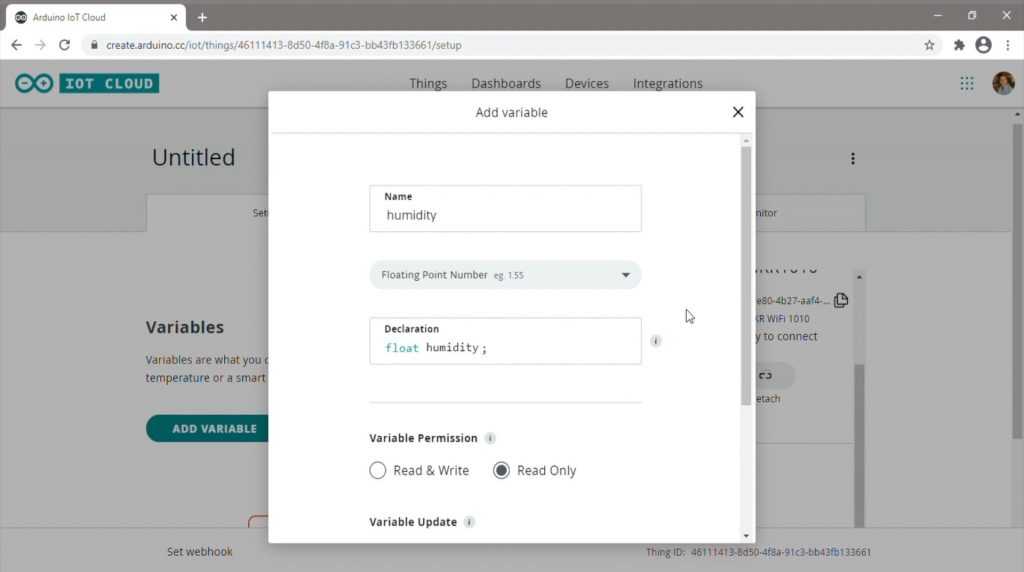
We then need to create variables for all of the metrics which we’d like to control over the cloud. This doesn’t need to be all of the variables you’re going to use in your sketch, just all of the ones which you want to be able to view or control over the cloud.
For our weather station, this is the temperature, pressure, humidity, light and a weather report string. For each variable, you’ll need to tell the system how often it should be updated and whether the cloud can just read the variable or read and write to the variable.
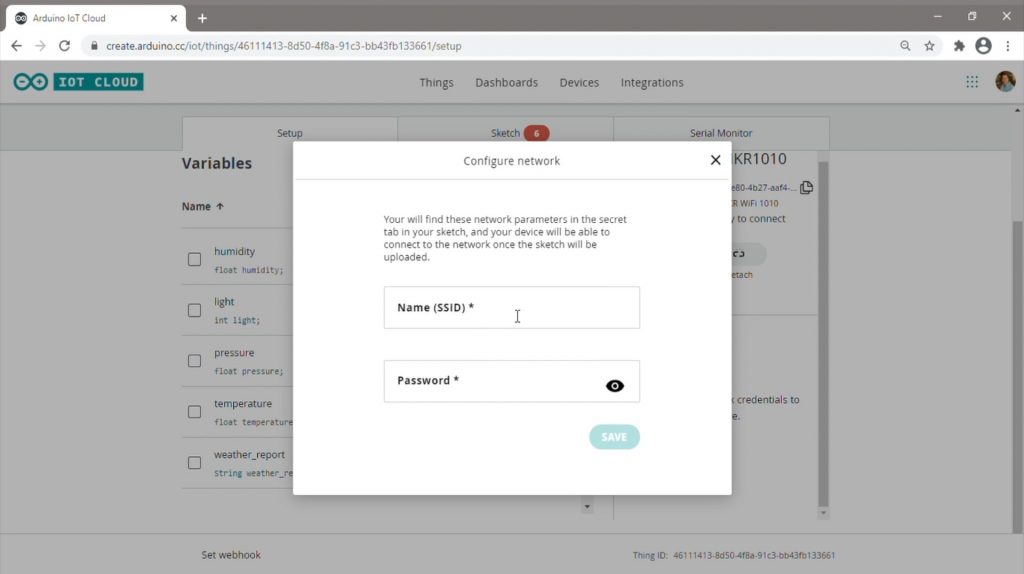
Once all of your variables are created, the last thing to do is to put in your WiFi network name and password so that the board is able to connect to it.
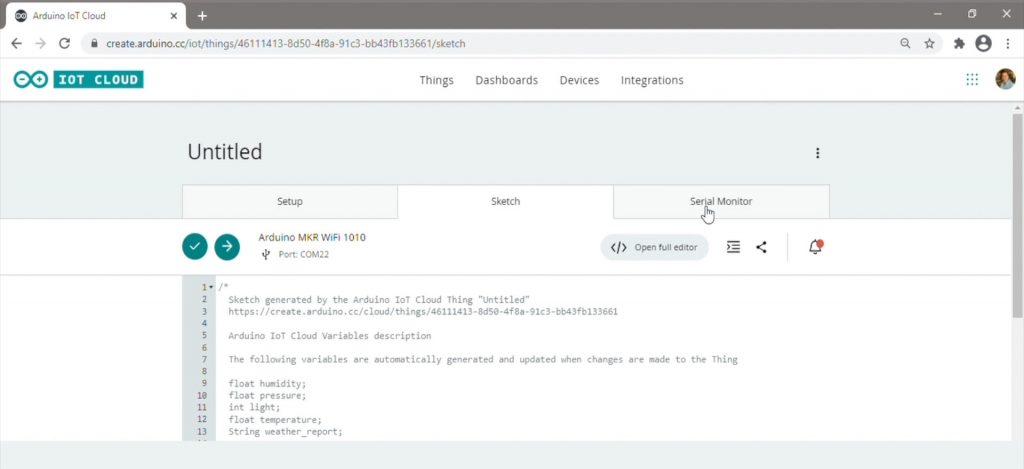
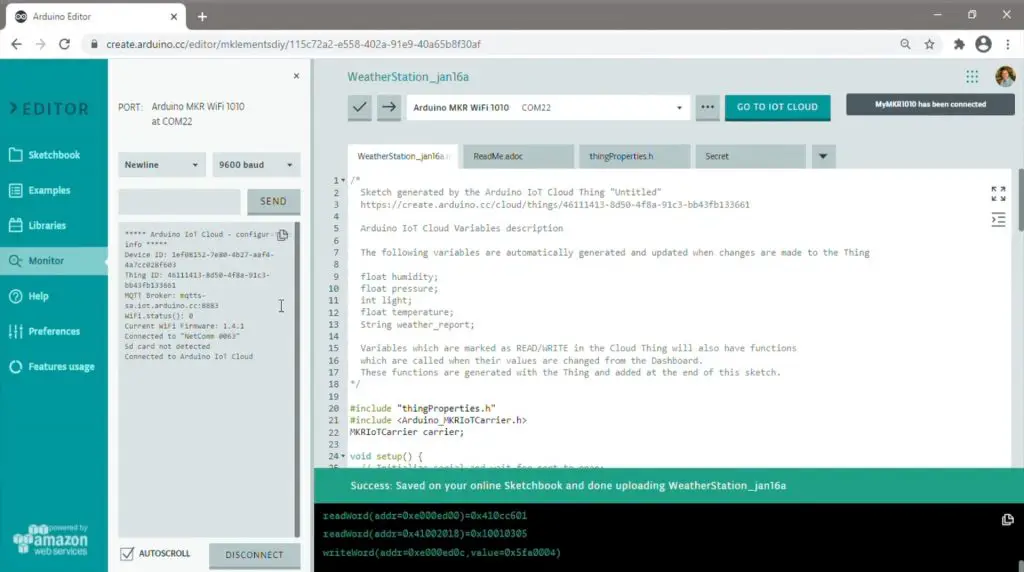
In this same area, you’re able to edit the sketch and view the serial monitor, but we’re going to rather do this in the full online editor where we have a bit more space. Before we leave, we just need to rename the Thing so that our sketch is named appropriately in the editor, we’ll call ours “WeatherStation”.
Programming Our Weather Station
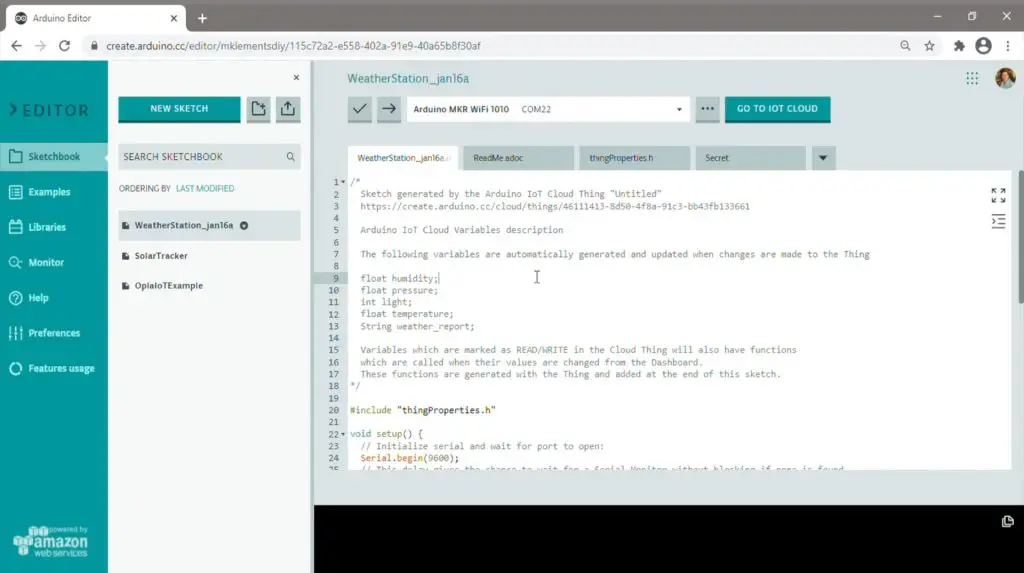
If you open up the web editor, you’ll see a basic generated sketch which looks similar to a typical Arduino sketch.
The main difference is that the cloud connection code has been added to the setup function and the variables that we created earlier are already available to use, so you don’t need to re-add them to the code.
We’re going to remove the main portion of this code and replace it with the Personal Weather Station example code as a starting point.
Let’s have a quick look at what the code does.
void setup() {
  // Initialize serial and wait for port to open:
  Serial.begin(9600);
  while (!Serial);

  // Defined in thingProperties.h
  initProperties();

  // Connect to Arduino IoT Cloud
  ArduinoCloud.begin(ArduinoIoTPreferredConnection);
  //Get Cloud Info/errors , 0 (only errors) up to 4
  setDebugMessageLevel(2);
  ArduinoCloud.printDebugInfo();

  //Wait to get cloud connection to init the carrier
  while (ArduinoCloud.connected() != 1) {
    ArduinoCloud.update();
    delay(500);
  }
  delay(500);
  CARRIER_CASE = false;
  carrier.begin();
  carrier.display.setRotation(0);
  delay(1500);
}
In the setup function, we start the serial monitor, for debugging information, we then import our “thing” properties and establish a connection with the Cloud. Lastly, we create an object to control the carrier board.
You’ll notice that there is a property called Carrier_Case which is set to false. This sets different calibration setpoints for the capacitive buttons so that they’re able to be activated through the case when the carrier is in it. We’ll be using it out of the case for now.
void loop() {
ArduinoCloud.update();
carrier.Buttons.update();
while(!carrier.Light.colorAvailable()) {
delay(5);
}
int none;
carrier.Light.readColor(none, none, none, light);
temperature = carrier.Env.readTemperature();
humidity = carrier.Env.readHumidity();
pressure = carrier.Pressure.readPressure();
if (carrier.Button0.onTouchDown()) {
carrier.display.fillScreen(ST77XX_WHITE);
carrier.display.setTextColor(ST77XX_RED);
carrier.display.setTextSize(2);
carrier.display.setCursor(30, 110);
carrier.display.print("Temp: ");
carrier.display.print(temperature);
carrier.display.print(" C");
}
if (carrier.Button1.onTouchDown()) {
carrier.display.fillScreen(ST77XX_WHITE);
carrier.display.setTextColor(ST77XX_RED);
carrier.display.setTextSize(2);
carrier.display.setCursor(30, 110);
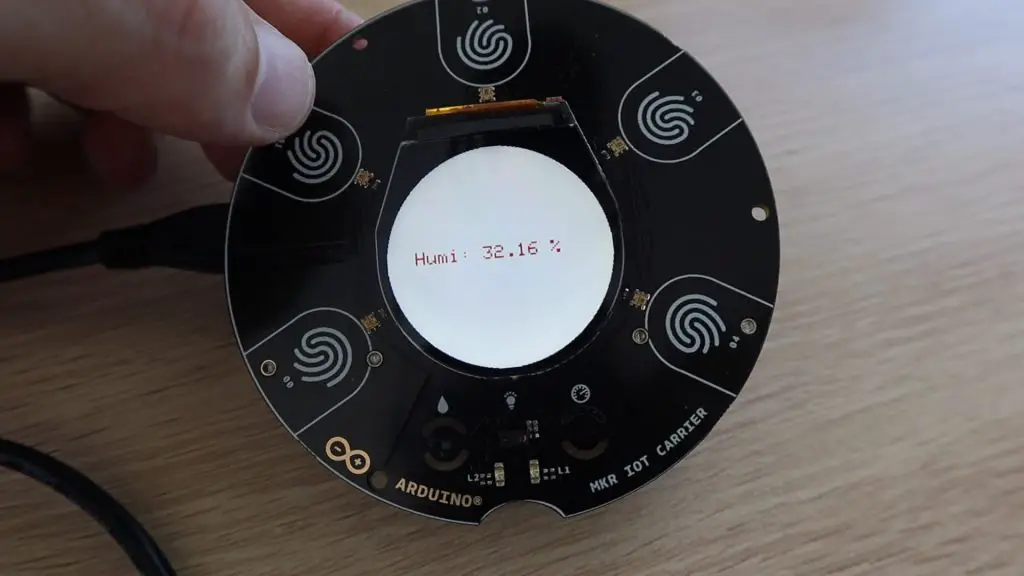
carrier.display.print("Humi: ");
carrier.display.print(humidity);
carrier.display.print(" %");
}
if (carrier.Button2.onTouchDown()) {
carrier.display.fillScreen(ST77XX_WHITE);
carrier.display.setTextColor(ST77XX_RED);
carrier.display.setTextSize(2);
carrier.display.setCursor(30, 110);
carrier.display.print("Light: ");
carrier.display.print(light);
}
if (carrier.Button3.onTouchDown()) {
carrier.display.fillScreen(ST77XX_WHITE);
carrier.display.setTextColor(ST77XX_RED);
carrier.display.setTextSize(2);
carrier.display.setCursor(30, 110);
carrier.display.print("Pressure: ");
carrier.display.print(pressure);
}
if (humidity >= 60 && temperature >= 15) {
weather_report = "It is very humid outside";
}else if (temperature >= 15 && light >= 700) {
weather_report = "Warm and sunny outside";
}else if (temperature <= 16 && light >= 700) {
weather_report = "A little cold, but sunny outside";
}
}In the loop function, we update the cloud variables, then get readings for the state of the buttons as well as readings from our sensors. We then check if any of the buttons have been pushed and if they have then we update the display accordingly. Lastly, we have some weather condition checks which generate a single line weather report if they’re met.
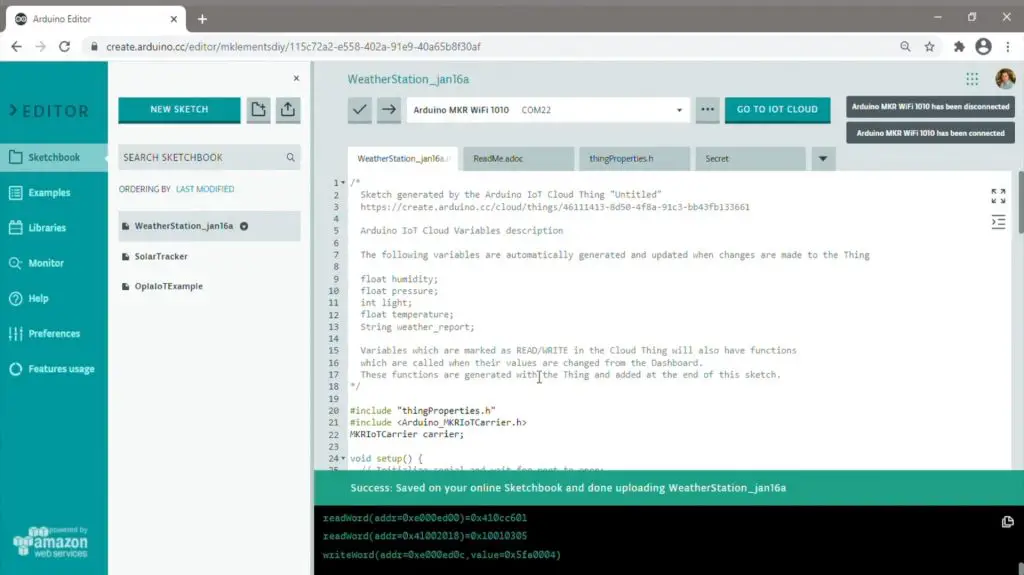
Let’s try upload this generic sketch to our board and see how it works.
When the board is mounted onto the carrier, it makes some ticking noise (which you can hear in the video) when the sketch is uploaded as the two relays are energised and de-energised.
Once the code is uploaded, we need to open the serial monitor to allow the board to run, as there was a “while loop” pause for this in the setup function.
We can then see the board connect to the WiFi and then establish a connection with the cloud.
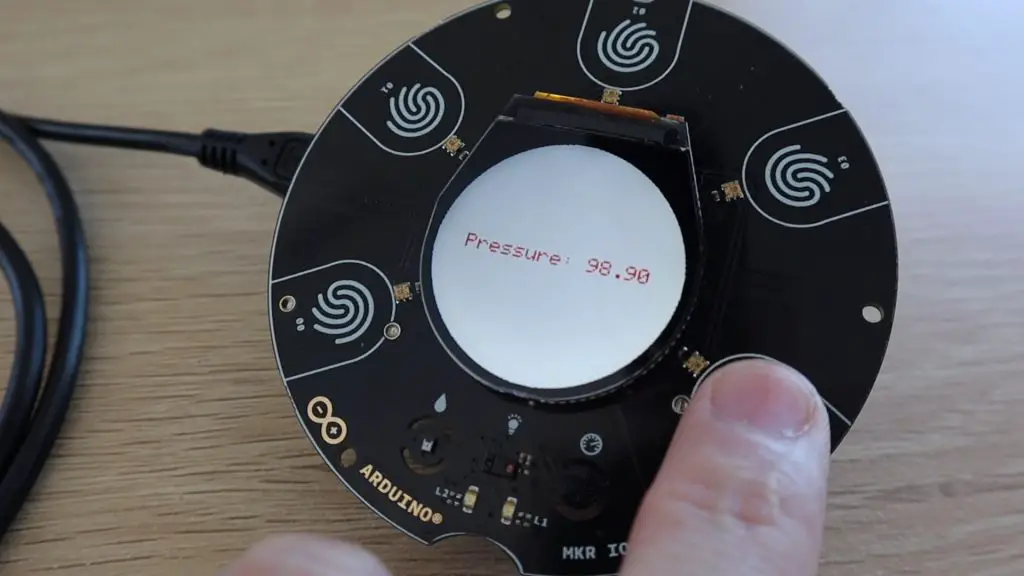
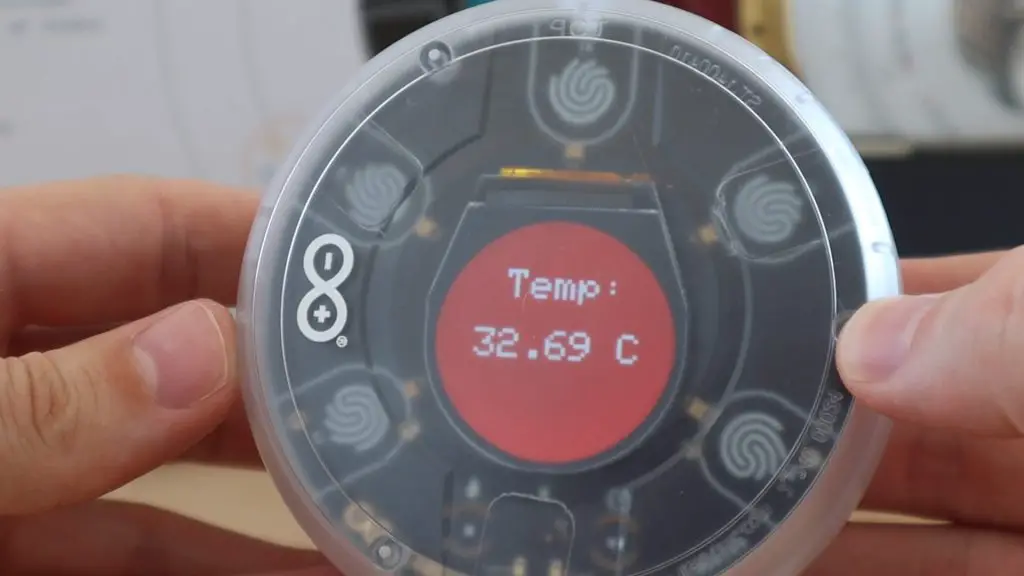
Let’s have a look at what is displayed on the carrier’s display.
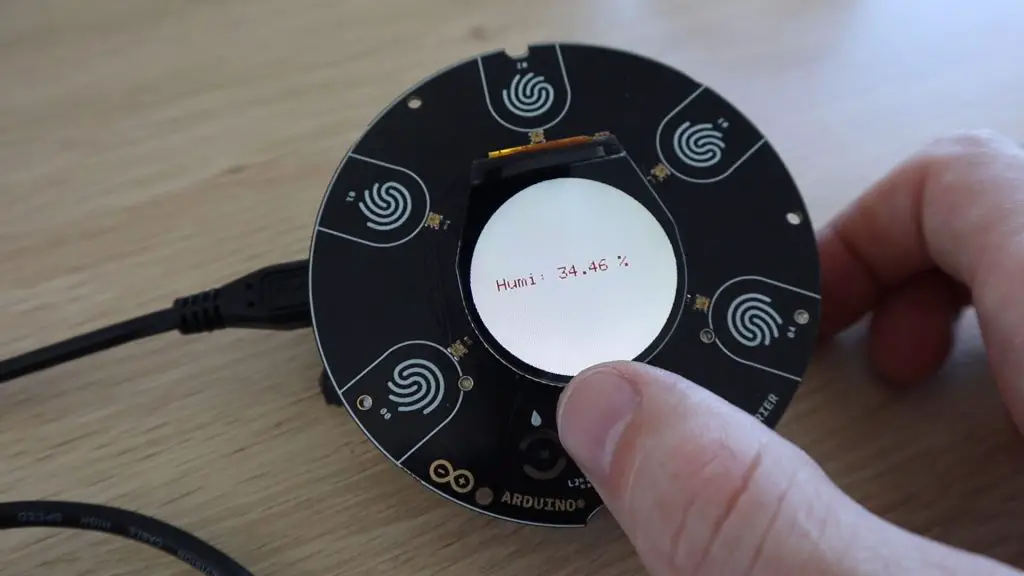
We saw from the code that we need to touch one of the first four buttons to get the display to change.
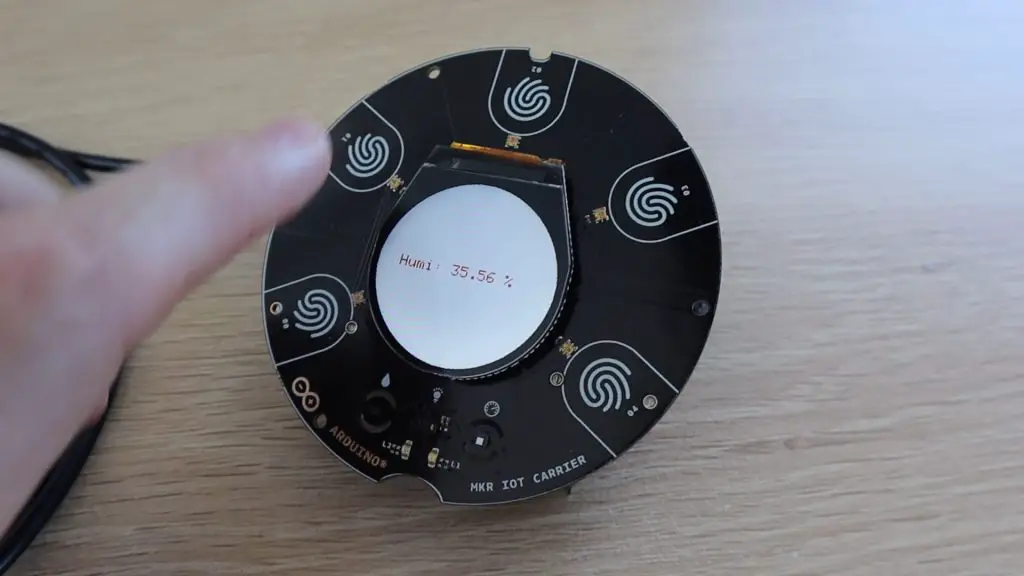
The first is temperature, then humidity, then light and then finally the pressure. The fifth button doesn’t do anything yet. Touching these four buttons reveals readings for each of the four variables we’ve set up.
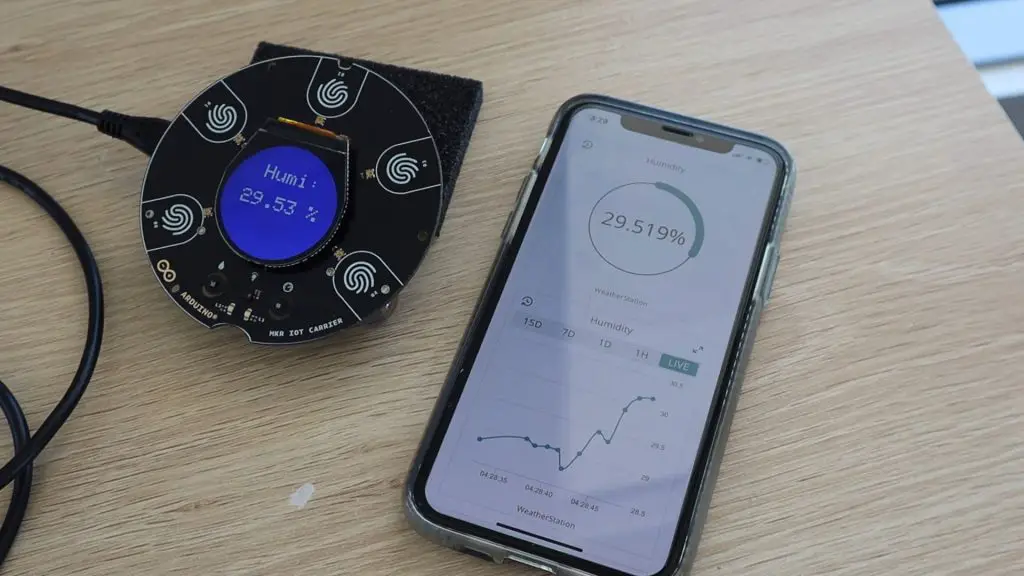
It looks like our Arduino is doing everything it should be and is connected to the cloud, so now let’s have a look at how we access the cloud data.
Creating A Cloud Dashboard For Our Weather Station
Now that we know that the board is connected to the cloud and should be posting data, we can create a dashboard to view the data over the internet.
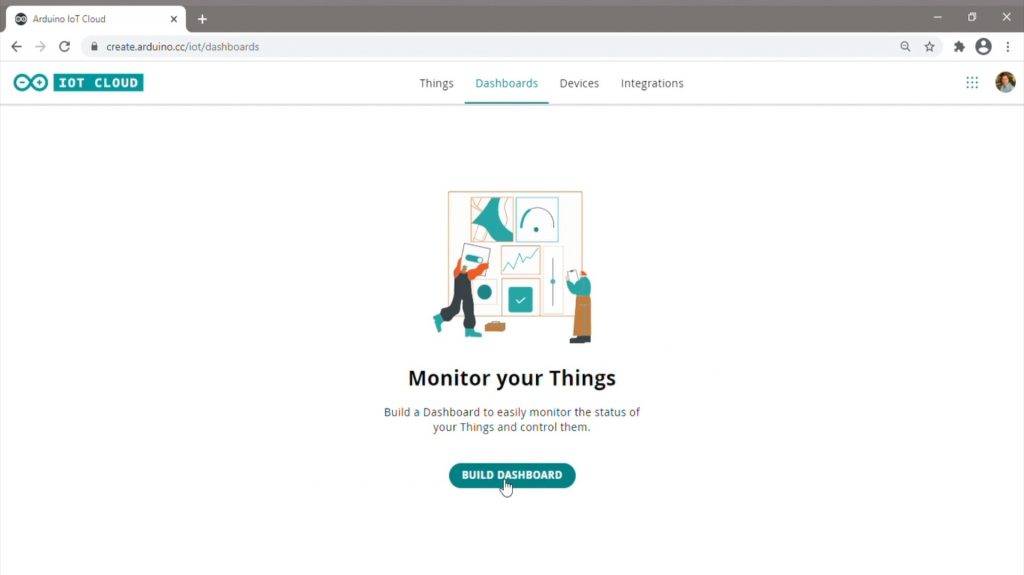
In the dashboard creator, we can create and arrange a number of displays, charts and buttons to view data from and interact with our Arduino.
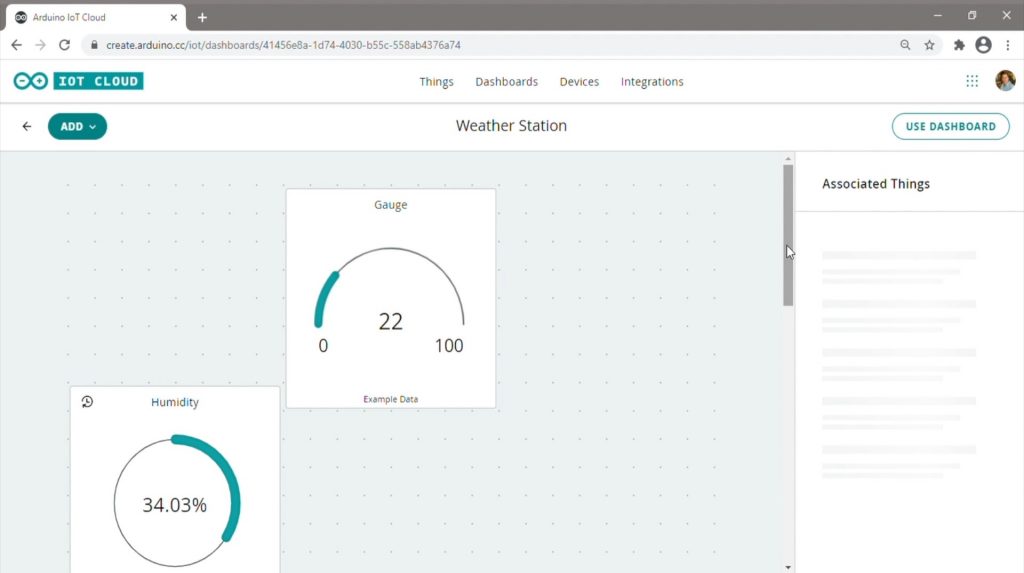
We’re going to start by adding a readout for each of our variables used in our IoT Weather Station. These will be a percentage readout for humidity, a gauge for temperature and then just a value readout for the pressure and the light level. We’ll also create a messenger to view our weather report information.
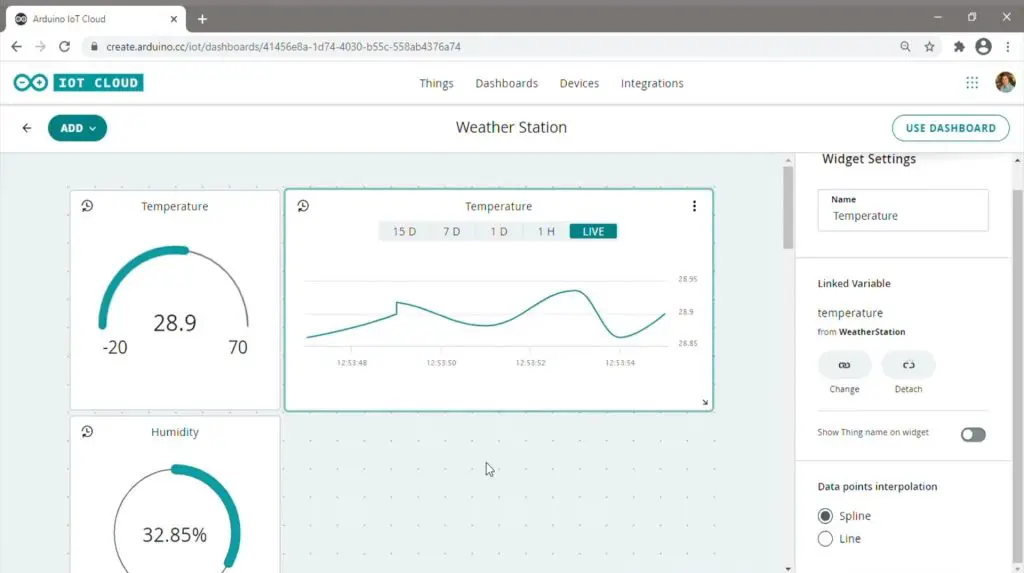
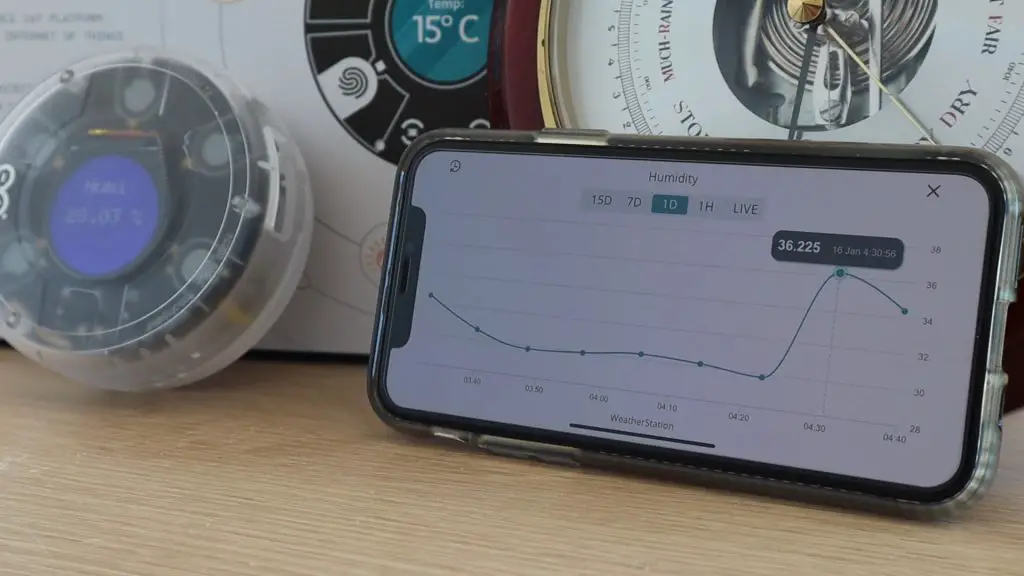
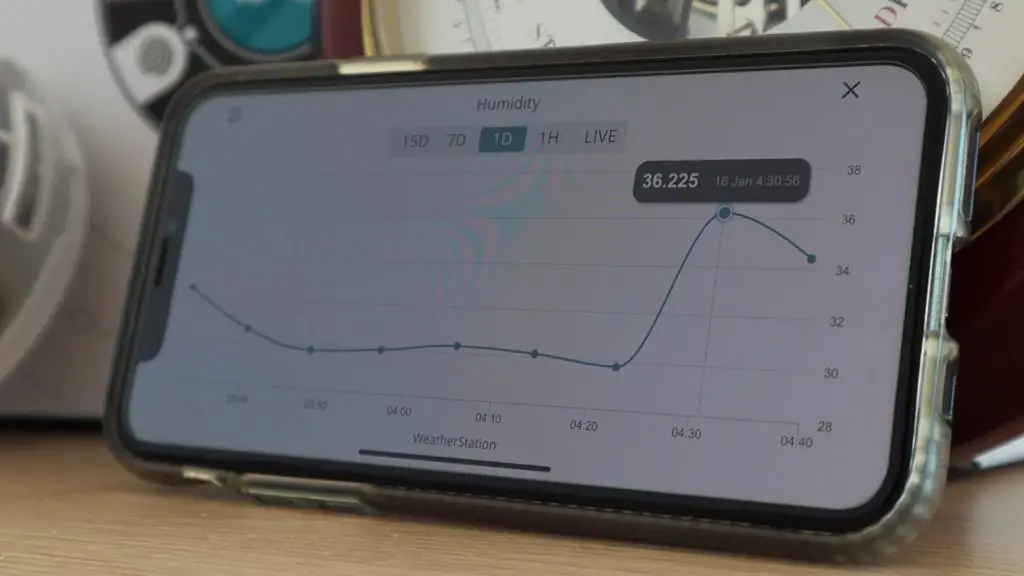
Instead of just being able to see the current values of the variables, it would be nice to also be able to see the historic data. We’re going to do this by adding a chart for each variable as well. Adding a chart allows you to see data for the past hour, day, 7 days and 15 days all plotted onto a line graph.
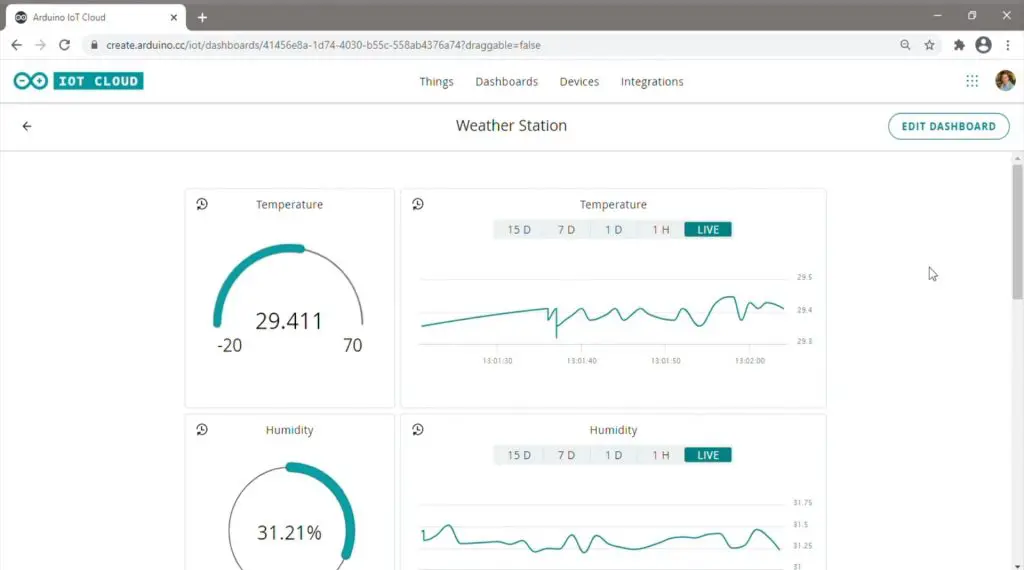
Once we’re done with creating the dashboard, we click on use dashboard to save the layout and start using it.
The data will continue to be logged on the cloud and you can access this dashboard through your browser from any computer.
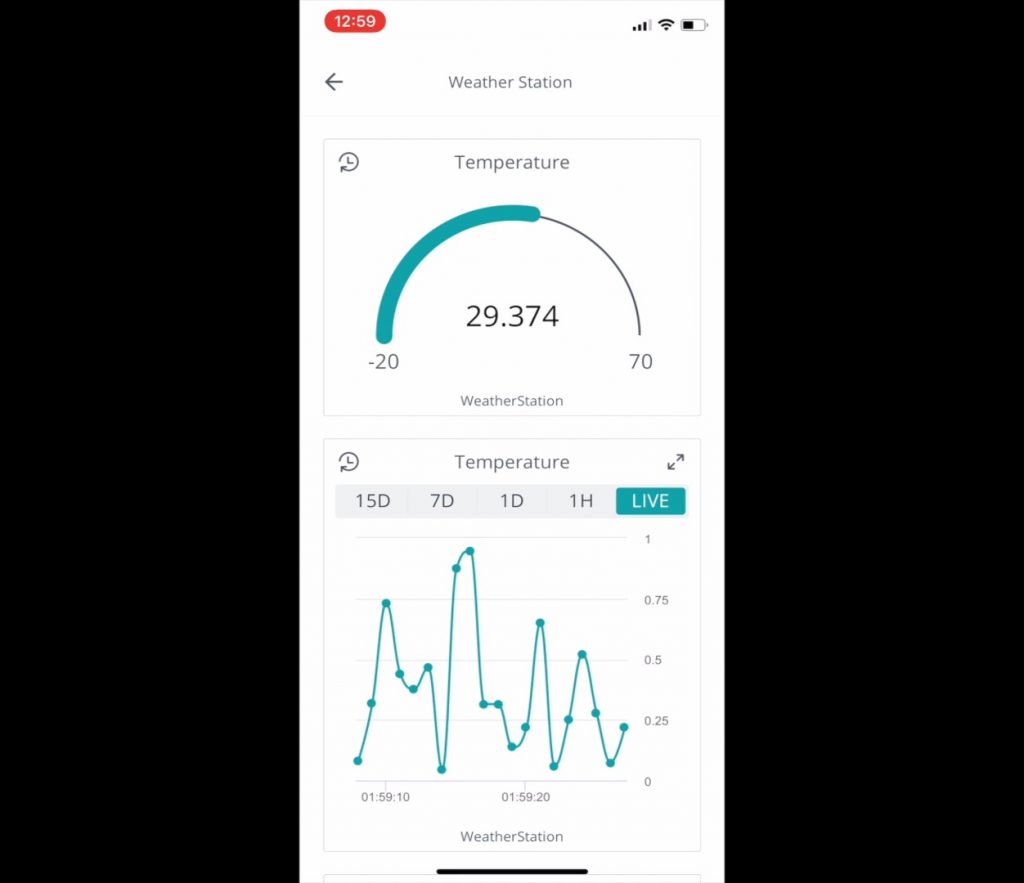
There is also an IoT Remote app which you can load onto your phone or tablet to view your created dashboards.
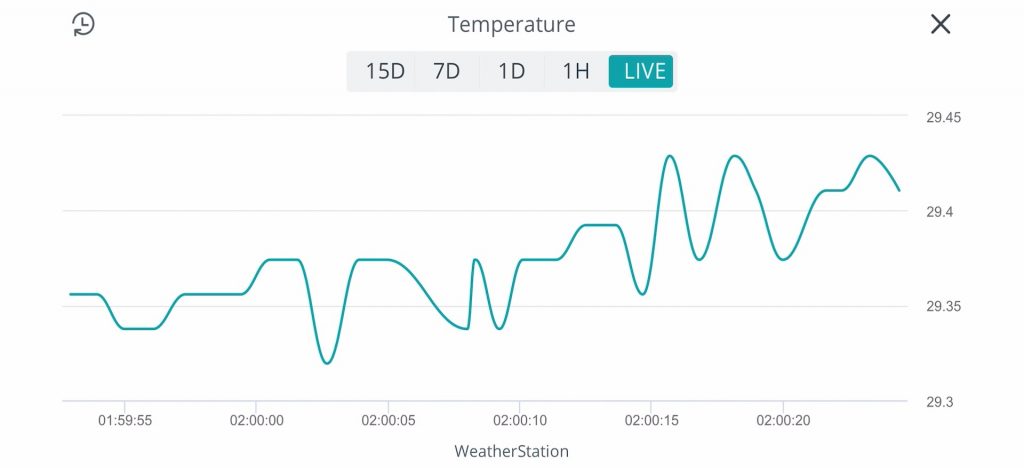
You can tap on the expand icon to open any of the charts in a landscape view to get better resolution.
It is quite interesting to play around with the sensors on your Arduino and see them respond on the cloud. Like covering up the light sensor.
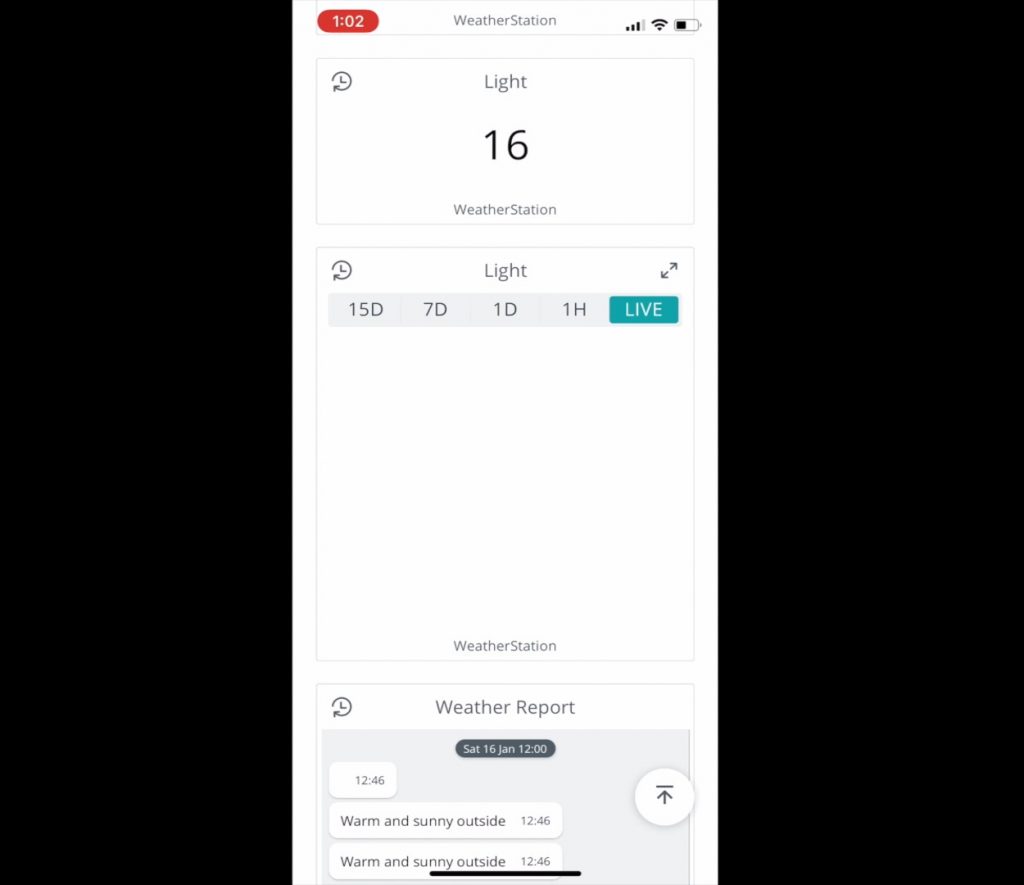
I put my finger over the light sensor and then watched the light level drop on my IoT Remote app, then removed it and watched it increase again.
Improving Our Weather Station
Now that we’ve got he basic IoT Weather Station up and running, let’s have a look at how we can improve upon it.
One limitation of the included sketch is that the data on the display is only updated each time the button is pushed. So if you leave it displaying the temperature, you just get a static readout and it doesn’t update the display until you press the temperature button again.
The general layout and colours are also a bit boring, so we’re going to try to change those too.
Here is my final version of the code:
/*
Sketch generated by the Arduino IoT Cloud Thing "Untitled"
https://create.arduino.cc/cloud/things/151ec4be-5c5f-47b2-9225-e383f05732e5
Arduino IoT Cloud Variables description
The following variables are automatically generated and updated when changes are made to the Thing
float humidity;
float temperature;
int light;
float pressure;
String weather_report;
Variables which are marked as READ/WRITE in the Cloud Thing will also have functions
which are called when their values are changed from the Dashboard.
These functions are generated with the Thing and added at the end of this sketch.
*/
#include "thingProperties.h"
#include <Arduino_MKRIoTCarrier.h>
MKRIoTCarrier carrier;
int modeSelect = 0;
int previousMode = 0;
int refreshCount = 0;
void setup() {
// Initialize serial and wait for port to open:
Serial.begin(9600);
//while (!Serial);
// Defined in thingProperties.h
initProperties();
// Connect to Arduino IoT Cloud
ArduinoCloud.begin(ArduinoIoTPreferredConnection);
//Get Cloud Info/errors , 0 (only errors) up to 4
setDebugMessageLevel(2);
ArduinoCloud.printDebugInfo();
//Wait to get cloud connection to init the carrier
while (ArduinoCloud.connected() != 1) {
ArduinoCloud.update();
delay(500);
}
delay(500);
CARRIER_CASE = true;
carrier.begin();
carrier.display.setRotation(0);
carrier.display.fillScreen(ST77XX_BLACK);
carrier.display.setTextColor(ST77XX_WHITE);
carrier.display.setTextSize(3);
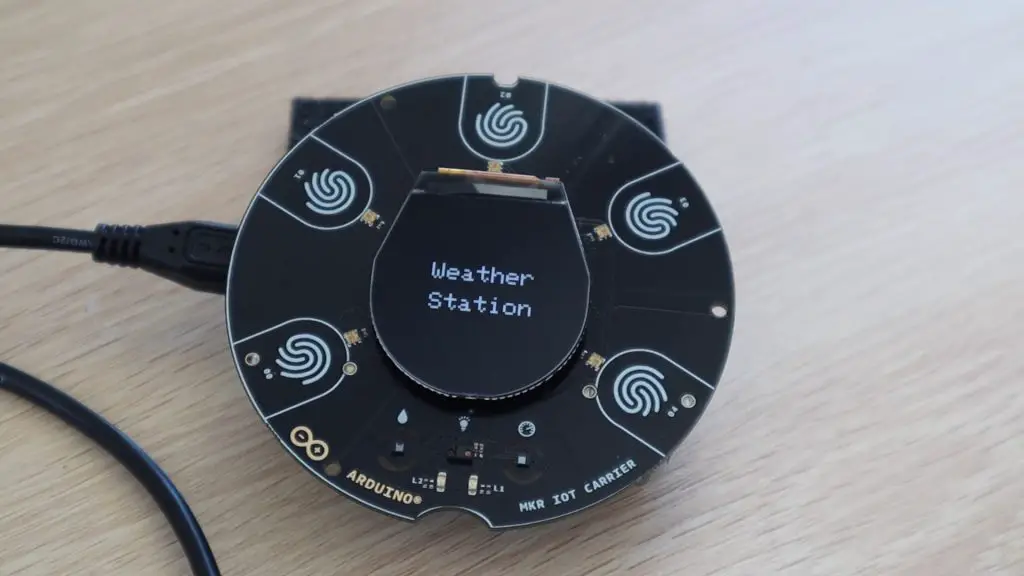
carrier.display.setCursor(60, 80);
carrier.display.print("Weather");
carrier.display.setCursor(60, 120);
carrier.display.print("Station");
delay(2000);
carrier.display.fillScreen(ST77XX_BLACK);
carrier.display.setTextColor(ST77XX_WHITE);
carrier.display.setTextSize(2);
carrier.display.setCursor(70, 80);
carrier.display.print("Connected");
carrier.display.setCursor(50, 110);
carrier.display.print("To IoT Cloud");
delay(2000);
}
void loop() {
ArduinoCloud.update();
carrier.Buttons.update();
while(!carrier.Light.colorAvailable()) {
delay(5);
}
int none;
carrier.Light.readColor(none, none, none, light);
temperature = carrier.Env.readTemperature();
humidity = carrier.Env.readHumidity();
pressure = carrier.Pressure.readPressure();
if(carrier.Button0.onTouchDown()) {
modeSelect = 0;
}
else if(carrier.Button1.onTouchDown()) {
modeSelect = 1;
}
else if(carrier.Button2.onTouchDown()) {
modeSelect = 2;
}
else if(carrier.Button3.onTouchDown()) {
modeSelect = 3;
}
else if(carrier.Button4.onTouchDown()) {
modeSelect = 4;
}
if(modeSelect != previousMode) {
updateDisplay();
previousMode = modeSelect;
refreshCount = 0;
}
else if (refreshCount >= 50) {
updateDisplay();
refreshCount = 0;
}
if (humidity >= 60 && temperature >= 15) {
weather_report = "It is very humid outside";
}
else if (temperature >= 25 && light >= 700) {
weather_report = "Hot and sunny outside";
}
else if (light <= 100) {
weather_report = "It is dark outside";
}
else if (temperature >= 15 && light >= 700) {
weather_report = "Warm and sunny outside";
}
else if (temperature <= 16 && light >= 700) {
weather_report = "A little cold, but sunny outside";
}
else if (humidity >= 90 && temperature <= 15) {
weather_report = "It is wet and rainy outside";
}
refreshCount++;
}
void updateDisplay () {
if (modeSelect == 0) {
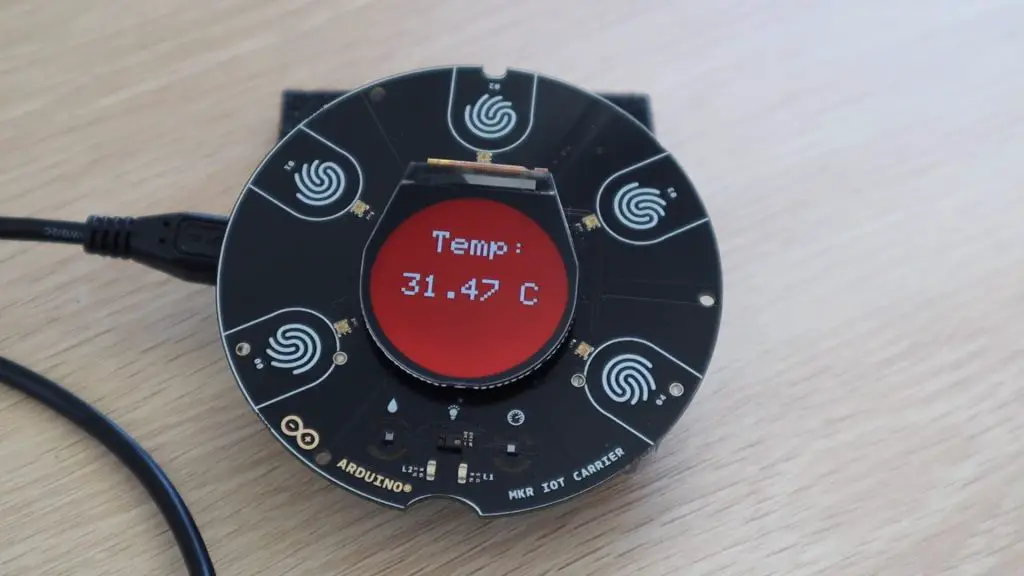
carrier.display.fillScreen(ST77XX_RED);
carrier.display.setTextColor(ST77XX_WHITE);
carrier.display.setTextSize(4);
carrier.display.setCursor(70, 50);
carrier.display.print("Temp:");
carrier.display.setCursor(40, 110);
carrier.display.print(temperature);
carrier.display.print(" C");
}
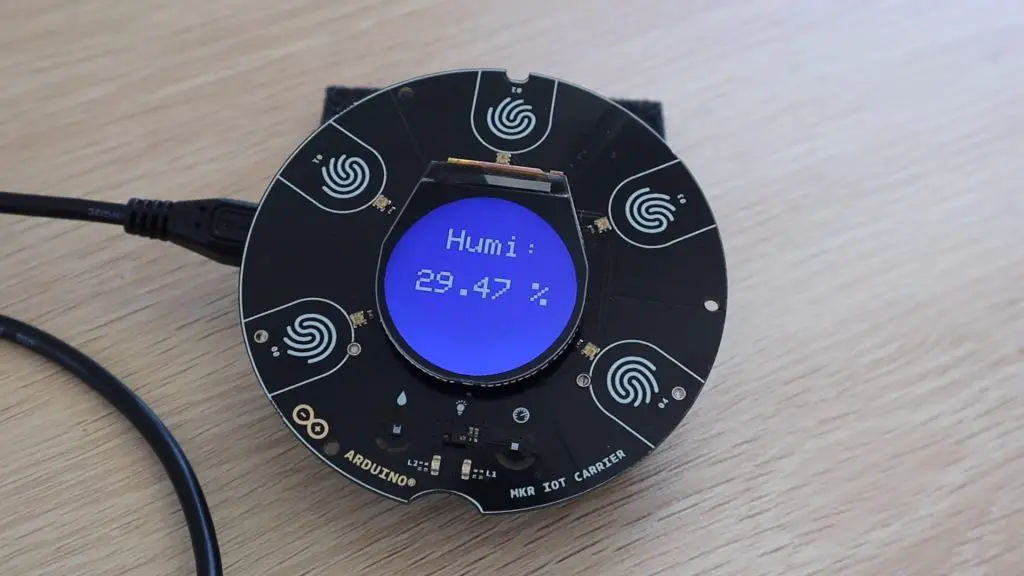
else if (modeSelect == 1) {
carrier.display.fillScreen(ST77XX_BLUE);
carrier.display.setTextColor(ST77XX_WHITE);
carrier.display.setTextSize(4);
carrier.display.setCursor(70, 50);
carrier.display.print("Humi:");
carrier.display.setCursor(40, 110);
carrier.display.print(humidity);
carrier.display.print(" %");
}
else if (modeSelect == 2) {
carrier.display.fillScreen(ST77XX_GREEN);
carrier.display.setTextColor(ST77XX_BLACK);
carrier.display.setTextSize(4);
carrier.display.setCursor(60, 60);
carrier.display.print("Light:");
carrier.display.setCursor(80, 120);
carrier.display.print(light);
}
else if (modeSelect == 3) {
carrier.display.fillScreen(ST77XX_CYAN);
carrier.display.setTextColor(ST77XX_BLACK);
carrier.display.setTextSize(4);
carrier.display.setCursor(60, 60);
carrier.display.print("Press:");
carrier.display.setCursor(20, 110);
carrier.display.print(pressure);
carrier.display.print(" Pa");
}
else {
carrier.display.fillScreen(ST77XX_BLACK);
}
}Let’s have a look at what I’ve changed.
I’ve started out by commenting out the serial monitor “while loop” as we now know that our board is connecting correctly and we don’t want to have to open up the serial monitor to get it to run, especially if it is powered by a battery.
I then added some splash screen text which is displayed on startup. This just says “Weather Station” and then “Connected To IoT Cloud” two seconds later.
In the loop function, I modified the code so that each button selects a display mode and the display is then updated in the background without having to press the button again. This means that pushing a button will change the current display, but otherwise, the display continues to be updated every 50 loop cycles. This relates to about every 3-4 seconds. If you update the display on every cycle then it slows the code down significantly and the display starts flickering.
I also added a few more weather reports based on some extra conditions.
I moved the display updates into their own function, which is called from the loop function, and then added some colour and changed the font size for each variable display. If we’ve got a colour display then we may as well use it!
Now let’s upload the new code and see how it looks.
The displays now look a bit more vibrant and they continue to refresh in the background, so you can mount the carrier onto a wall and have a function weather station display.
I also added some functionality to the last button, which now blacks out the display. This could be useful at night to make it less distracting and may use less power when running on a battery since this is an OLED display.
You can now watch the display and the app update simultaneously.
Powering The Weather Station Using A Battery
The last thing I’m going to try is putting the IoT Weather Station into the case and powering it using a 18650 lithium-ion battery.
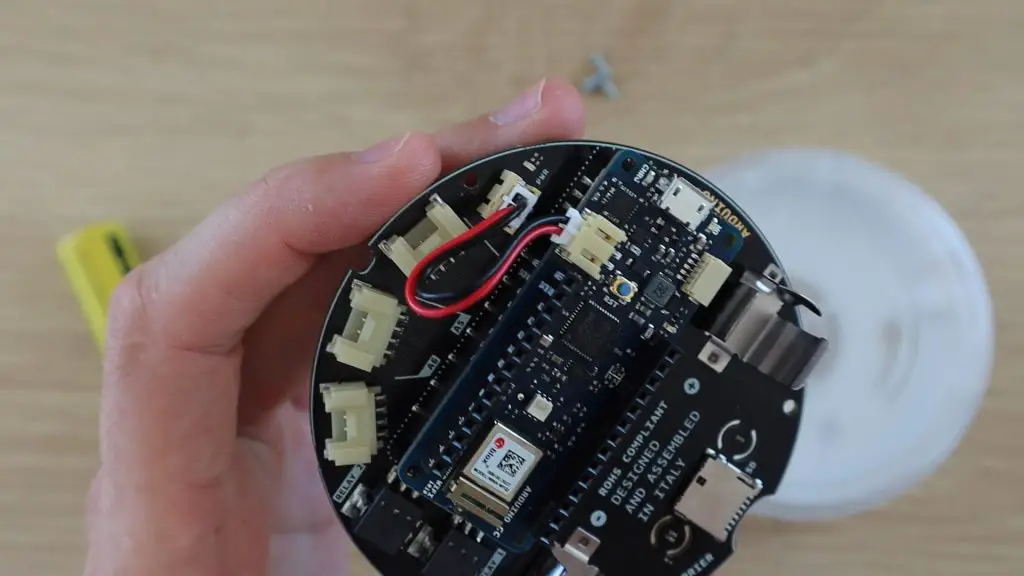
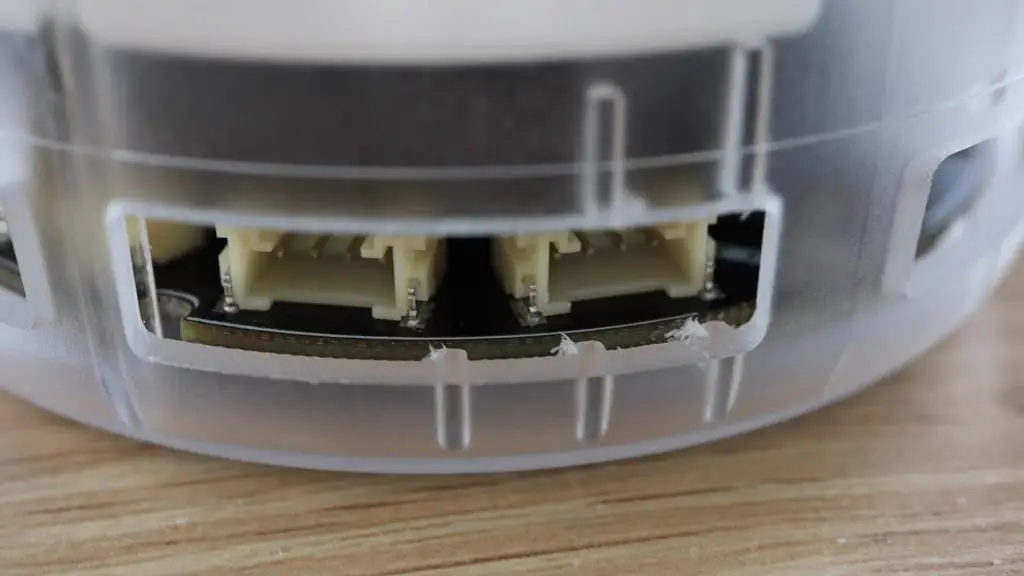
For that, we need to add this little power lead between the board and the Arduino.
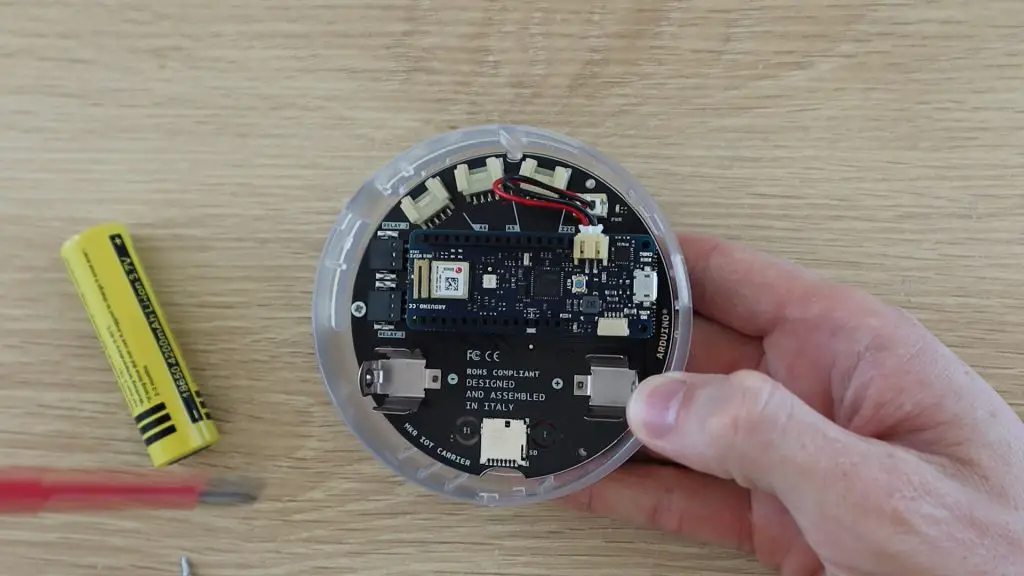
We can then screw the carrier into the case using the three included screws to hold it up against the front of the case.
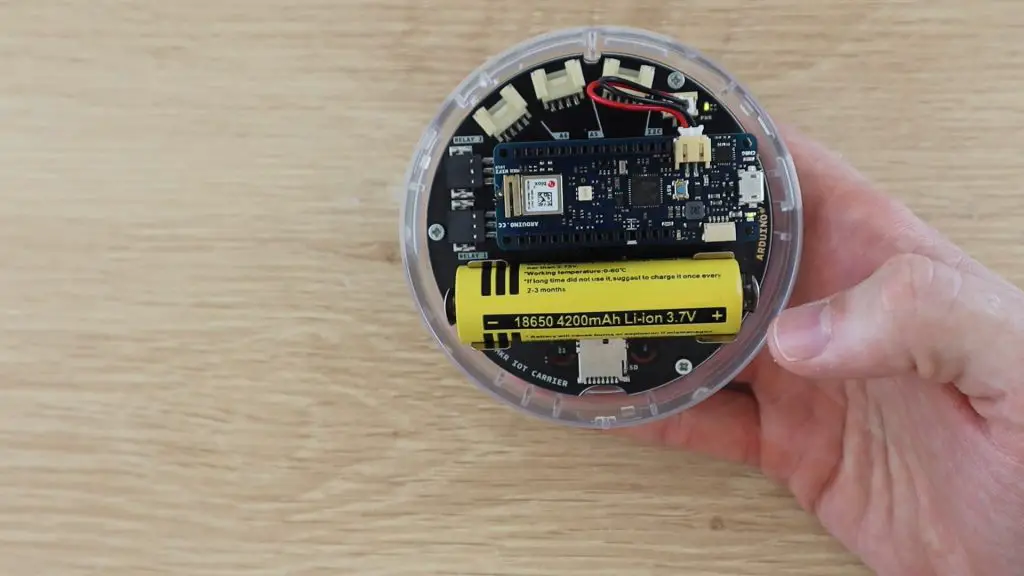
Now let’s add the battery to power it on and close up the back cover.
One thing I would have liked on the carrier is a power switch. As soon as you put the battery into the carrier then the Arduino turns on and you can’t turn it off again without removing the back cover and removing the battery.
We can now change the display by pressing on the cover above the buttons.
The capacitive touch buttons work really well without the case but are a little too sensitive when inside. It’s really easy to activate them by mistake when you’re handling the case or even hovering a finger near another of the buttons.
That’s it for our weather station. We now have a standalone device which is connected to our WiFi network and is continuously posting the data to the cloud, which we can then access on our computer or mobile devices.
Next, I’d like to try adding a rain sensor and anemometer or wind direction indicator to the station using the analogue inputs. I’d need to also make some leads for these so that they can be placed outside.
Let me know what you think of this IoT Weather Station in the comments section below. Have you built anything interesting with your Arduino Opla IoT Kit?
Hi Michael,
I built the weather station from the Opla IoT kit. Thanks for the help.