Following one of my previous projects where I built a weather station dashboard using InfluxDB and Grafana on the reTerminal, I had quite a few requests to do a more in-depth tutorial on how to get each part set up and running. So in this tutorial, I’m going to be going through each part of the process, step-by-step, so that you can get a similar setup running on your Raspberry Pi.
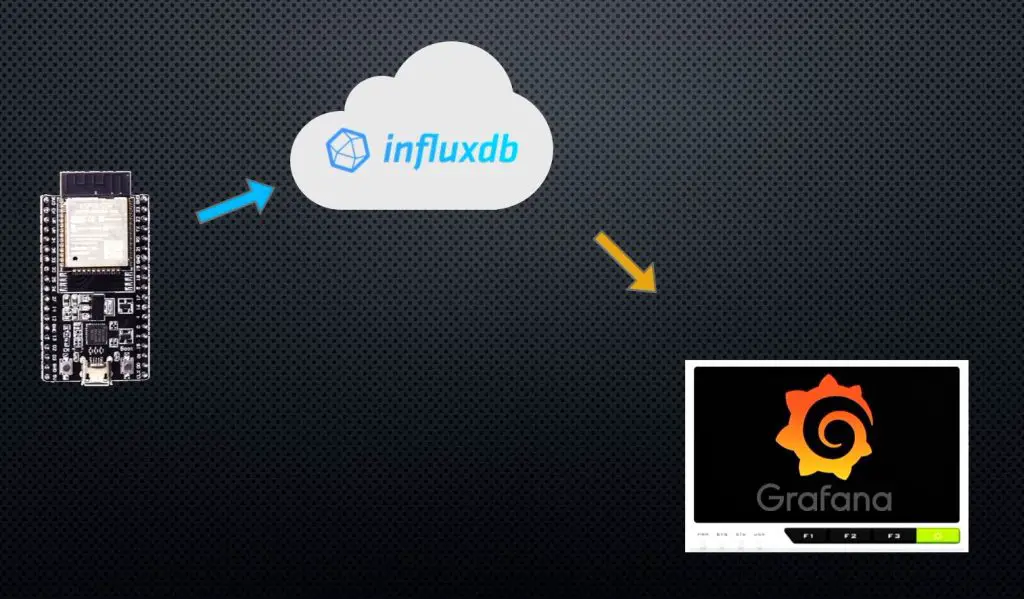
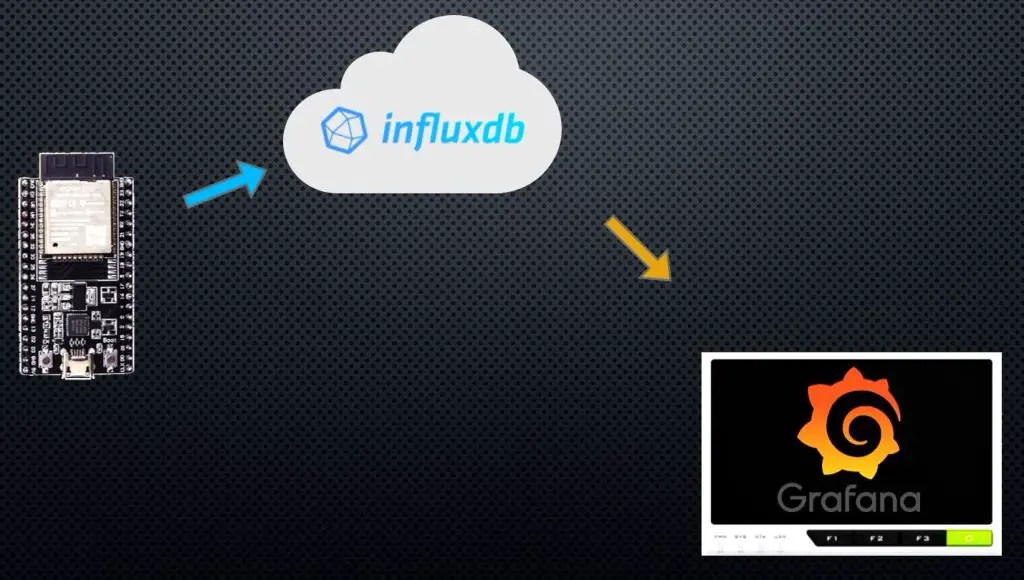
In this example, we’re going to use an ESP32 as our data collection node to collect temperature, humidity and pressure readings from some attached sensors. It’ll then post these readings to an InfluxDB database and we’ll then use Grafana to visualise the data. Don’t worry if you don’t understand what these are or how they work together just yet, I’ll explain them each in more detail as we work through them.
Here’s my video tutorial, read on for the written tutorial:
Note: This tutorial assumes that you know the basics of using and programming an ESP32 development board using the Arduino IDE and using a RaspberryPi, including some terminal commands.
What You Need For This Tutorial
- Raspberry Pi 4b (A Pi 3b/Pi 400/CM4 can also be used) – Buy Here
- Power Supply – Buy Here
- ESP32 Microcontroller – Buy Here
- MicroUSB Cable – Buy Here
- Grove Sensor’s From Beginner Kit – Buy Here
- Breadboard – Buy Here
- Breadboard Jumpers – Buy Here
You’ll also need a monitor (my portable monitor shown at the end), keyboard and mouse for your Raspberry Pi in order to install and set up your Grafana weather dashboard.
Some of the above parts are affiliate links. By purchasing products through the above links, you’ll be supporting my projects, with no additional cost to you.
Setting Up Your ESP32 Microcontroller To Capture Sensor Readings
Connecting Your Sensors To Your ESP32 Microcontroller
Let’s start with setting up the ESP32 microcontroller and sensors.
You’ve probably seen people use a Raspberry Pi for this part as well, but I prefer to use a microcontroller like an ESP32 or Arduino for a number of reasons.
The first, and probably the most important, is that once you’ve programmed your microcontroller, you can switch it on and off as often as you’d like without having to go through a shutdown and bootup process. You don’t have to worry about it corrupting its memory card or locking up. It is entirely dedicated to the task you’ve programmed it to do and it’ll do it very reliably, even when you’ve had power interruptions.

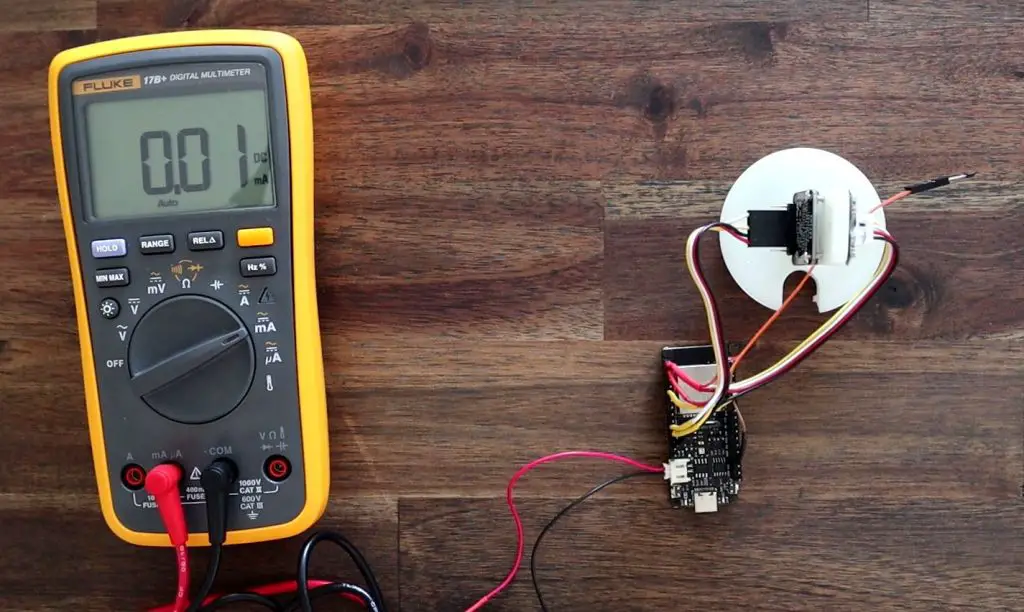
The second is its power consumption, which really comes into play if you’re building a battery-based project.
You’ll struggle to get even a Raspberry Pi Zero W to run at under 260mA or a little over 1W, while I’ve managed to get an ESP32 based device like the Firebeetle board used in my weather station to run as low as 0.01 mA, or at an average of 1 mA when transmitting data over WiFi. So this is over 250 times more power-efficient, meaning that it can either run 250 times longer than the Pi or you can use a battery 250 times smaller than with the Pi – both of which can be a huge advantage.
We’re going to connect two sensor modules to our ESP32, the DHT11 sensor on the left connected to pin 4 for measuring the temperature and humidity and then a BMP280 sensor on the right connected to the I2C interface to measure atmospheric pressure.
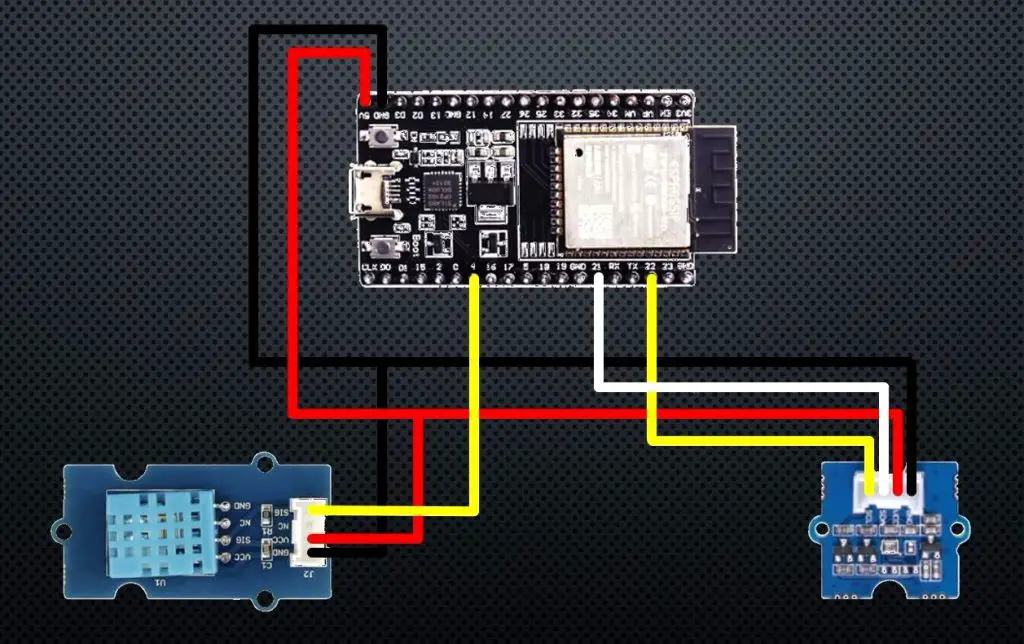
I’m going to connect the two sensors to my ESP32 on a breadboard using some jumpers for this example so that it’s easy for you to follow. The sensors I’m using are also from Seeed studios, they call them grove sensors and they’re particularly useful for people who are new to electronics because they include all of the components required to drive the sensor on the PCB so you don’t need to worry about adding resistors or making multiple power connections to drive them. I’ve cut the ends off the grove connectors to plug them into my breadboard, you could do this or just plug your jumpers straight onto the grove sensor pins.
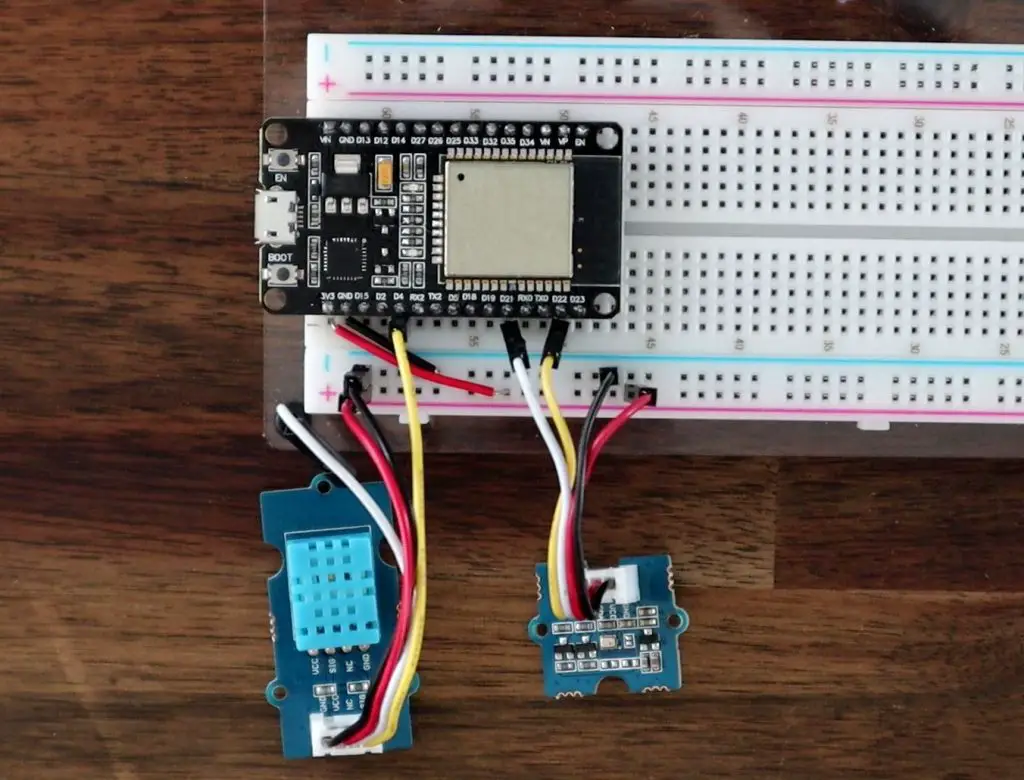
We can then connect our ESP32 to our computer and use the Arduino IDE to program it.
Sending Our Sensor Data To InfluxDB
Now that our sensors are connected, we want our ESP32 to take readings from them and then post these readings to an InfluxDB database over WiFi.
InfluxDB is a time series database package, which you can think of as a sort of large excel spreadsheet where each data point that you send to it will be stamped with the date and time that it was received. So if you send it a temperature reading, it’ll stamp it with the date and time that it was received and then store it in the table. This makes it really useful for any information that changes over time – like a weather station.
This database can either exist in the cloud, on InfluxDB’s servers, or it can be installed on our Raspberry Pi and run on our local network. I’m going to use InfluxDB’s servers in this example because this option works well if you’ve got a number of microcontrollers collecting information that are not all on the same network and it also allows you to reboot and make modifications to your Pi’s software without interrupting the collection of data as well. Either way, this setup process is largely the same for both options.

Programming Our ESP32
Let’s have a look at our code and how to get the information into our database. I’ve put together this example sketch which I’m going to load onto it.
Download the example sketch from my GitHub repository.
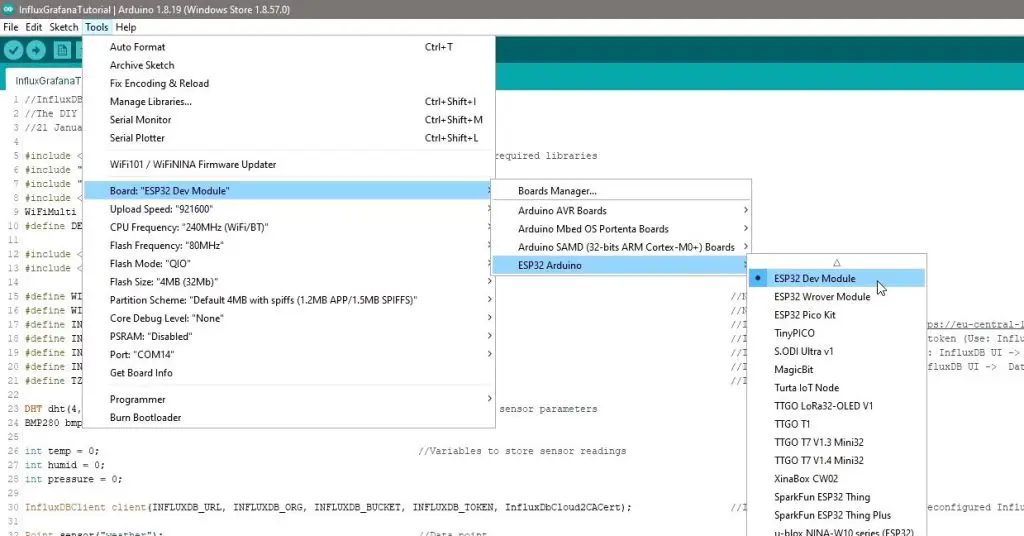
You’ll need to have installed the ESP32 board using the IDE’s boards manager. Then make sure that you’ve got your board selected as “ESP32 Dev Module” and check that you’re using the correct COM port.
In the code, we start by importing our required libraries, these are basically packages of code that have been written to make it easier to interface with certain devices or objects. So for example, the DHT.h library contains all of the code required to communicate with our DHT sensor and we can then just use a single line in our code to ask this library to send us the temperature reading.
We’ve then got a section to define our WiFi and InfluxDB connection settings. Don’t worry too much about these yet, they’ll make sense when we get to the Influx DB setup portion of the tutorial.
We then need to create two sensor objects using our libraries, create three variables to store each of the fields that we want to measure and then set up our InfluxDB connection.
We then have our setup function, which is a set of code that is run just once when the ESP32 is first switched on.
This function starts communication with our computer for debugging, then sets up our sensors using the libraries we called up earlier, then connects to our WiFi network and then connects to our InfluxDB database.
Next, we have our loop function. This is a set of code that is run over and over as long as the ESP32 continues to be powered. So in our case, we add another line of readings to our table in our database each time we loop through this set of code.
First, we use our DHT11 and BMP280 libraries to get the current sensor readings from the two sensors.
We then tell our database library which column of our table each of these values should be stored under.
We then check our WiFi connection and re-connect to the network and database if we need to.
Finally, we write our measured values to our database as a single line of data so that the three measured values will all have the same timestamp.
This last portion of the code just displays the measured values on the Serial monitor, which makes it easier to debug. We can then check that the information that is showing up in our database is the information that our ESP32 is measuring.
Before we go ahead and upload the code to our ESP32, we need to add those network and database parameters at the beginning of the code.
The first two are our WiFi network name and password, so we can enter those right away. Remember that the network name is also case sensitive and needs to include any spaces or underscores as well.
The next five parameters are all required for our InfluxDB connection, so we’ll need to open up InfluxDB and create our database before we can finish this off.
Creating Our InfluxDB Database
Create an InfluxDB Account
Now that we’ve got our ESP32 set up to record the data from our sensors, we need a place to store the data. So let’s go to influxdata.com and then go to “Login” in the top right and click on “Login to InfluxDB Cloud 2.0”.
You’ll then be given an option to log in to your existing account or sign-up for a new account. I’m going to register a new account for this tutorial.
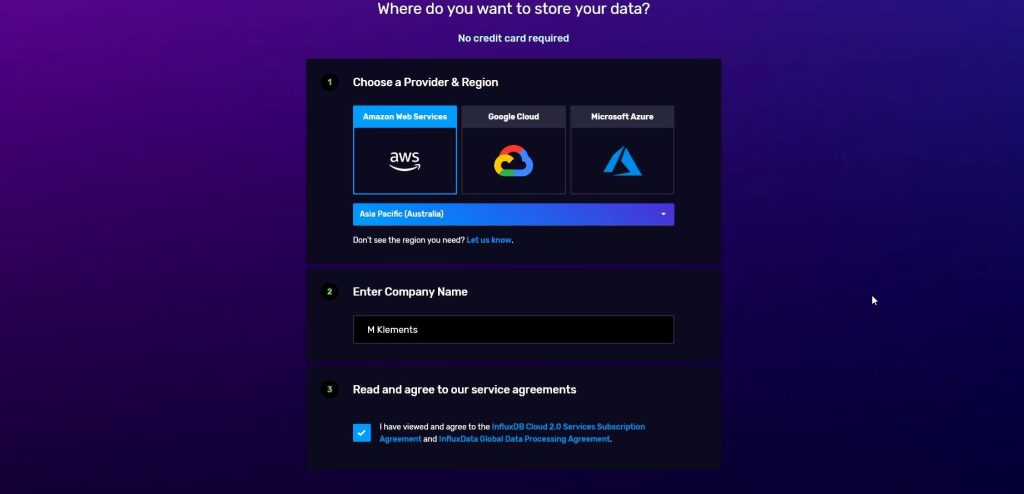
Once you have confirmed your email address, you’ll arrive at this page. You can leave the default Amazon Web Services provider, just select your correct region, then enter your name or company name and tick the box if you agree to their service agreements.
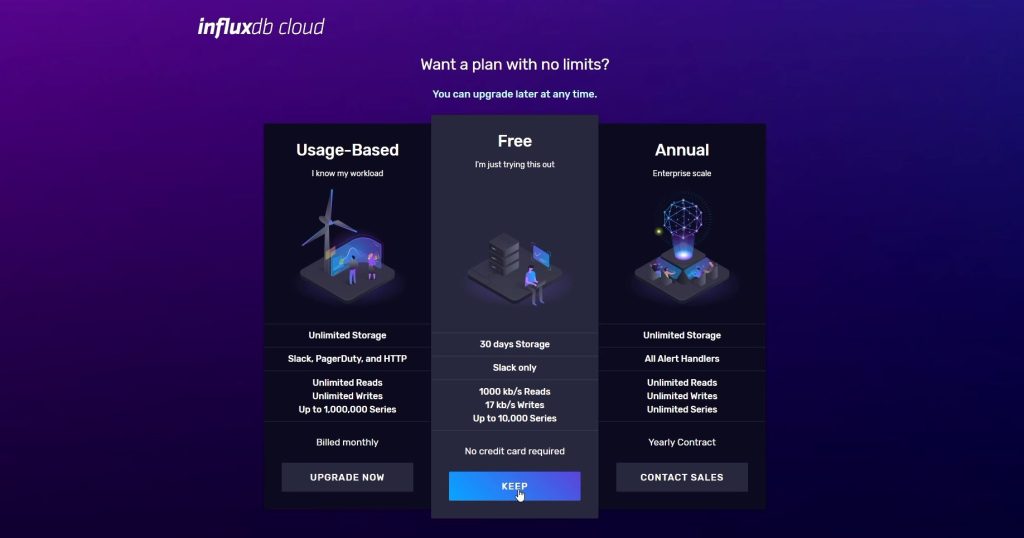
You’ll then be asked to select a plan. Unless you’re wanting to capture large amounts of data or store the data for long periods of time, the free plan will be fine.
You should then arrive at your home page.
Get Your Database Connection Details
InfluxDB have already done some work on interfacing with Arduino based devices, so we can take advantage of that to make the integration easier. So let’s click on “Load Your Data” and then find the “Arduino Client Library”.
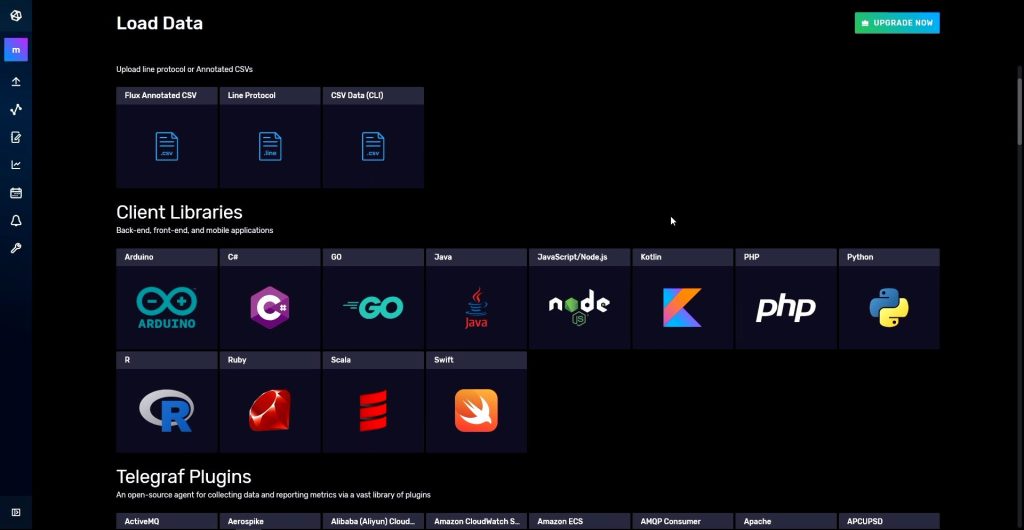
Now you’ll see two boxes with a generic API token and bucket, and below that are some prepopulated snippets of code.
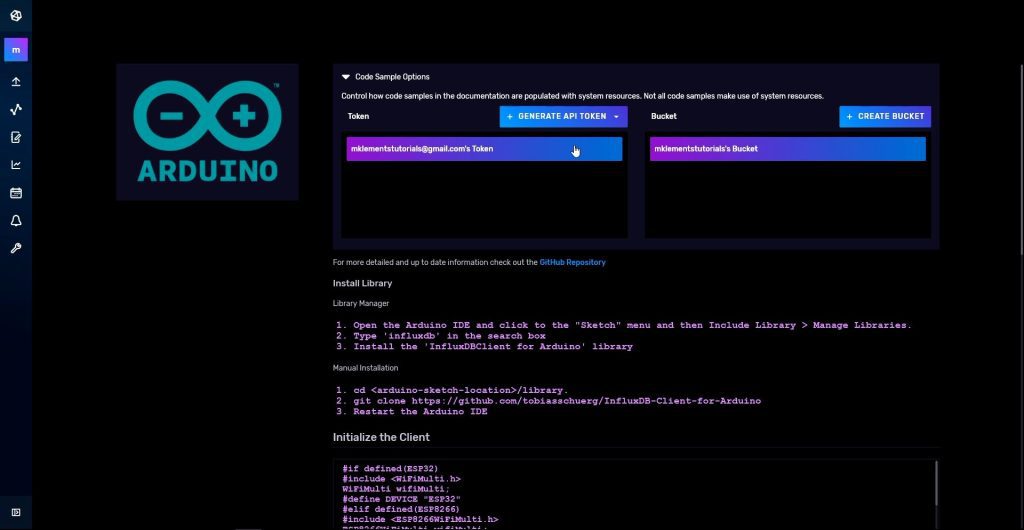
We can then just copy these fields across to our Arduino sketch. My sketch is based on this example code, so you can just copy the whole snippet and replace the section in my sketch if you’d prefer.
It’s perfectly fine to use this generic token and bucket, but if you’re going to be using multiple devices to capture data and if you want to set an expiry on your data so that it’s automatically deleted after a period of time then you’ll want to create your own, which you can also do right from this page, so let me show you how to do that as well.
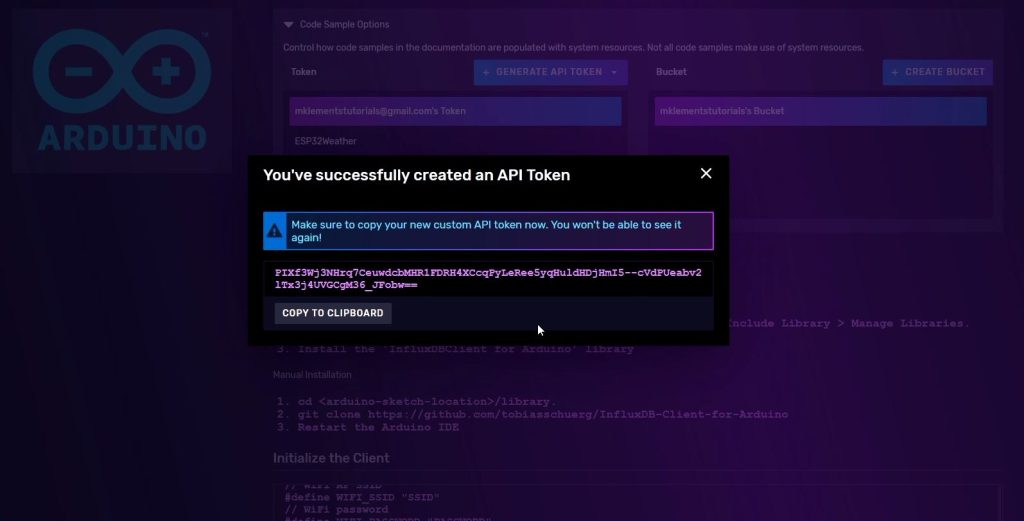
First, let’s create our Token. This is basically a key that allows an external device to read, write and manage the information in our database. We can set this up with customizable options to limit what the device with the key can do, but for simplicity let’s just create an “All Access API Token”. This will enable our device to read, write and modify our database.
Give the token a name, which is commonly the device name, then click save. We can then copy this token and replace the one in our Arduino sketch.
Next, we want to create our bucket, which is essentially a fresh database. In InfluxDB each database needs to have a retention policy. The retention policy is how long data is stored in the database before being automatically deleted. This prevents the database from becoming bulky and slow to query, so it should be chosen based on how often you’re writing data to it and how long you expect to need to see historic trends.
In our case we’re only going to be writing to our database every few minutes, so let’s go with 30 days. This will also allow us to visualise monthly trends as well as highs and lows on our dashboard.
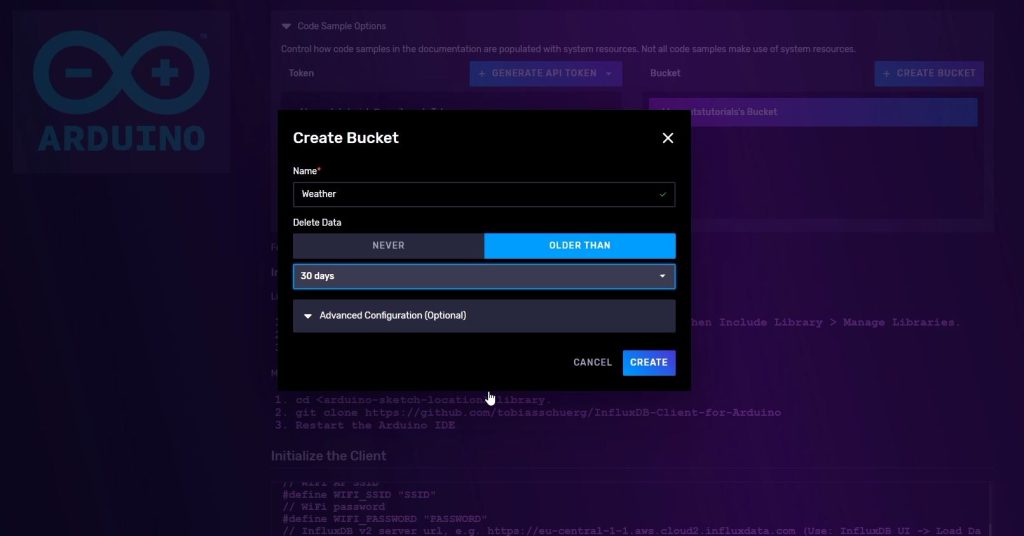
Make sure that the new bucket is selected and we can then go down to the code and copy the field across to our sketch.

The last field to set in the sketch is the timezone, this should be set correctly so that your database entries are stamped with your local time, which you’ll need to establish yourself. They give you some examples for common locations and a web resource for naming other locations, mine is set up for Sydney Australia.
Adding The Database Connection Details To Your Sketch
With our InfluxDB and network settings added to our code as above, we can now upload the code and make sure that our ESP32 is writing the information to our InfluxDB database.
I’m also going to quickly change the delay between readings to 5 minutes as the indoor temperature and humidity don’t change that quickly.
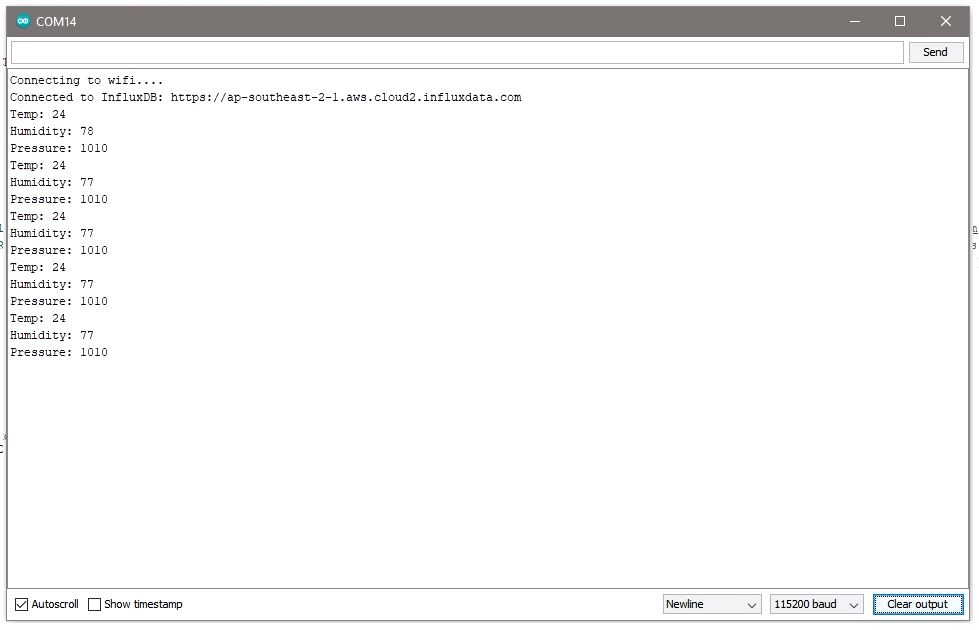
Once your code has successfully been uploaded to your ESP32, open up the serial monitor and check that you’re getting the expected feedback. This will also give you the latest readings that are being taken from the sensors. Any errors in connecting to the WiFi network or InfluxDB should also come up here.
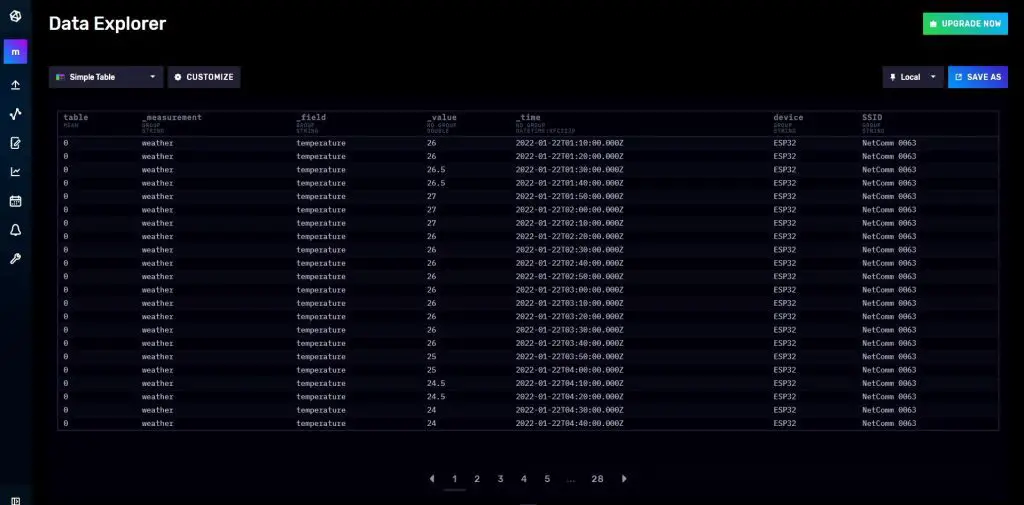
Now we’ve got our information being sent to and stored in our database, but it’s pretty intimidating to look at a table full of numbers, so we need a way to gather the information we’re interested in from our database and display that information in a format that’s easier to visualize and that’s where Grafana comes in.
InfluxDB does now have its own visualisation tools, but I find Grafana to be a lot more powerful and user friendly.
Installing Grafana on Our Raspberry Pi
As with InfluxDB, Grafana can be run in the cloud, on their own servers, or on a Raspberry Pi on our local network. For this example, I’m going to be installing and running it on my reTerminal, which is a Raspberry Pi based touch display terminal.
I’m starting with a fresh install of Raspberry Pi OS Buster, and we can install Grafana by entering the following commands into our terminal.
sudo apt-get install -y apt-transport-httpssudo apt-get install -y software-properties-common wgetwget -q -O - https://packages.grafana.com/gpg.key | sudo apt-key add –echo "deb https://packages.grafana.com/enterprise/deb stable main" | sudo tee -a /etc/apt/sources.list.d/grafana.listsudo apt-get updatesudo apt-get install grafana-enterpriseOnce we’ve got Grafana installed, we then need to start the application, you’ll see in your terminal window from the previous step that it explains to you how to start the service and verify that it is running.
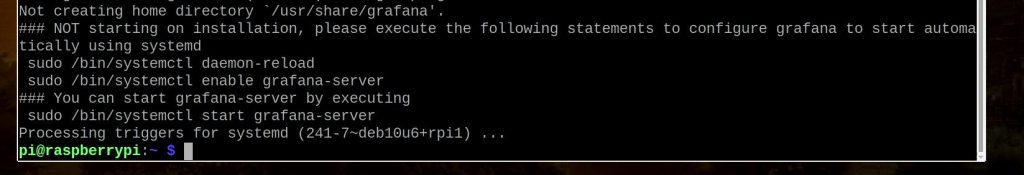
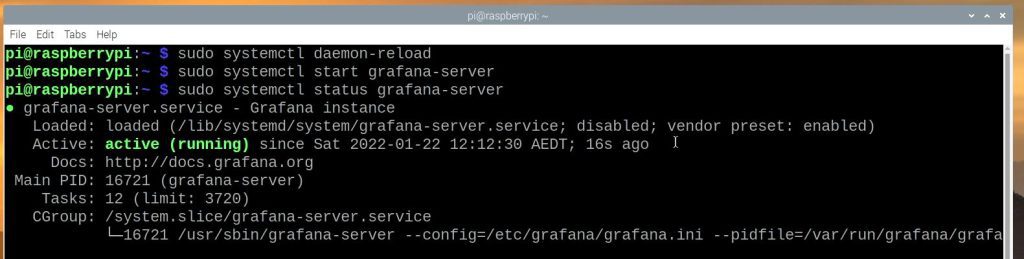
So let’s enter those commands:
sudo systemctl daemon-reloadsudo systemctl start grafana-serversudo systemctl status grafana-serverYou should then see a green message like this saying that it is running.
Lastly, we need to set it to automatically run on start-up.
sudo systemctl enable grafana-server.serviceCreating Our Grafana Weather Dashboard
Connect Grafana To Our InfluxDB Database
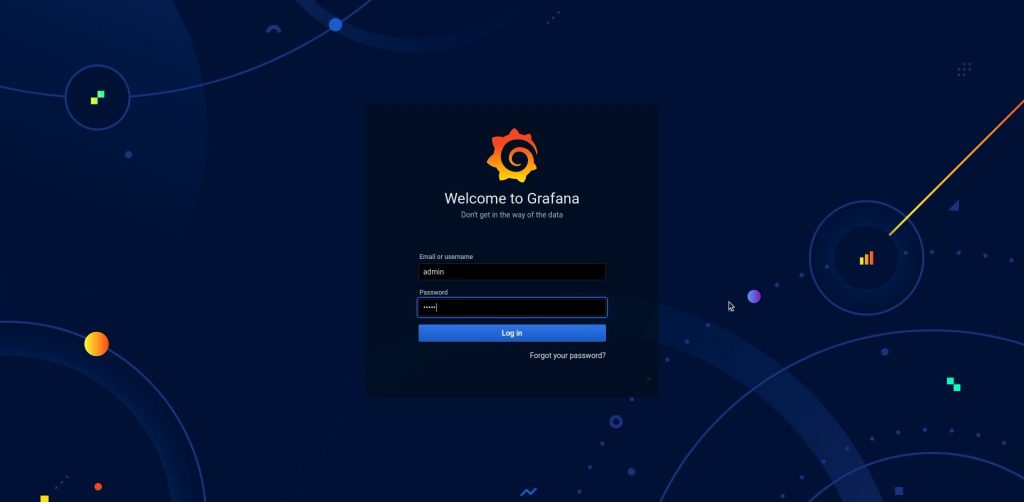
With Grafana now running on our Pi, we can access the dashboard by opening a new browser window and entering the URL – http://localhost:3000/login
You’ll then need to enter your username and password, the defaults are admin for both, and you’ll probably then be prompted to create a new password.
Now that we’re on the Grafana user interface page, we need to configure a data source to be able to read the information stored in our InfluxDB database.
So let’s click on “Add your first data source”.
We can then choose our data source type, which in our case is InfluxDB and we’ll then land on a configuration page like this.
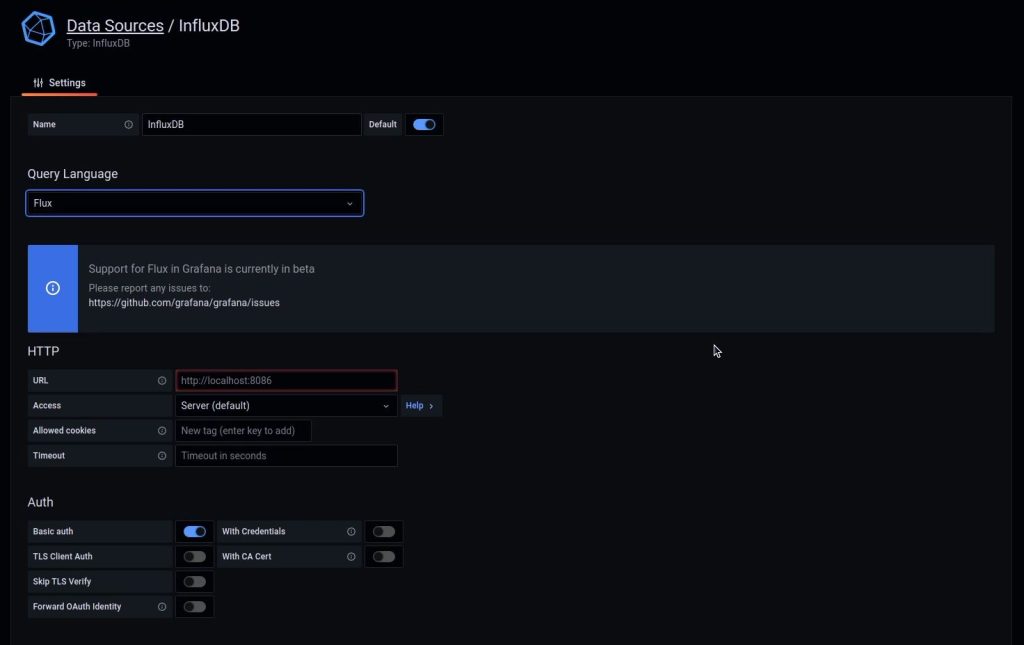
This is a similar process to the one we followed to allow our ESP32 to write information to the database, we’re now just telling Grafana how to read information from the database.
You can change the name of the data source if you’d like, I’m going to leave it as InfluxDB.
Next, we’re going to change the Query Language to Flux. Flux is more of a scripting-style query format rather than an SQL query format, so is a bit more versatile than InfluxQL.
The URL is the same as the one used in the Arduino code, so we can just enter it or copy it across from our code.
You can leave most of the default settings selected for now.
Let’s add our username and password here.
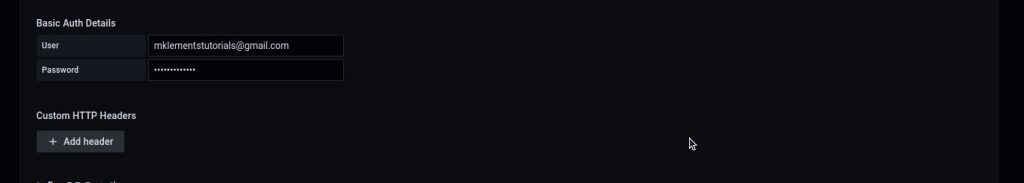
Then lastly we need to enter our database details.
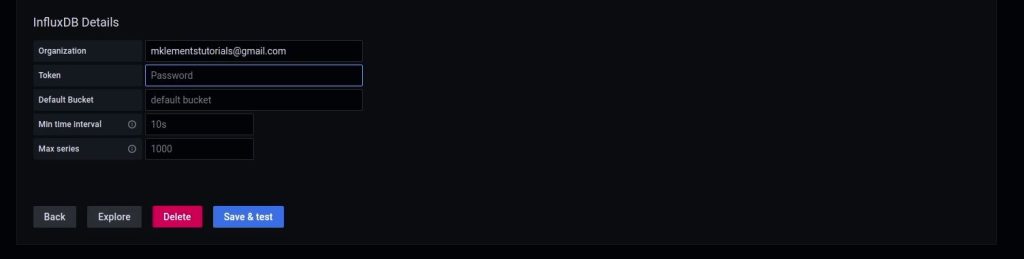
These are the same details that we used in the Arduino sketch, with the exception of the token. The token is similar to the ESP32 token except that that token could be a write-only token and this could be a read-only token. I say “could” because they’re just “all-access” tokens in this example, but in practice should be read-only or write-only. So let’s open InfluxDB to generate this token.
We’ll go to tokens, then click on Generate API Token.
I’m going to create this as an all-access token again, but you can configure it as a read-only token if you’d like.
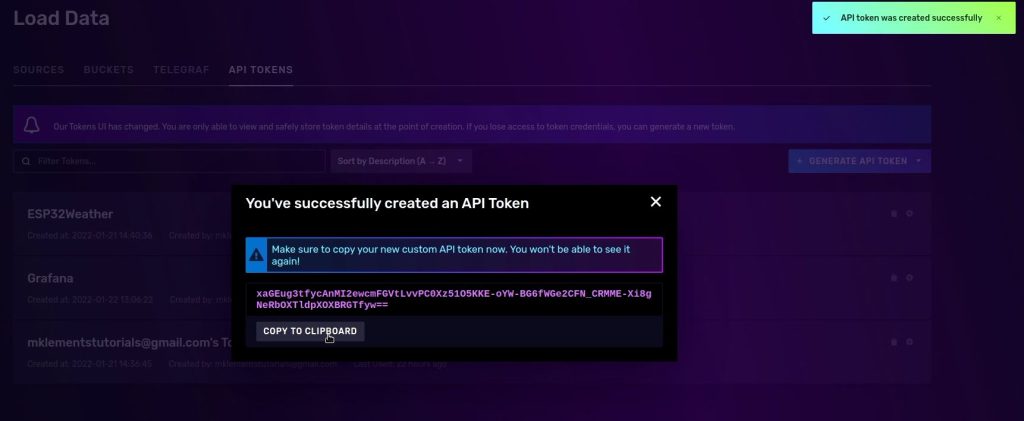
Then we just need to copy the generated token over to our configuration page.
I’m going to set the minimum time interval to 60s as we’re only writing to our database every 5 minutes and I’ll leave the max series as 1000.
Now click on “Save and Test” to see if Grafana is able to access your database.
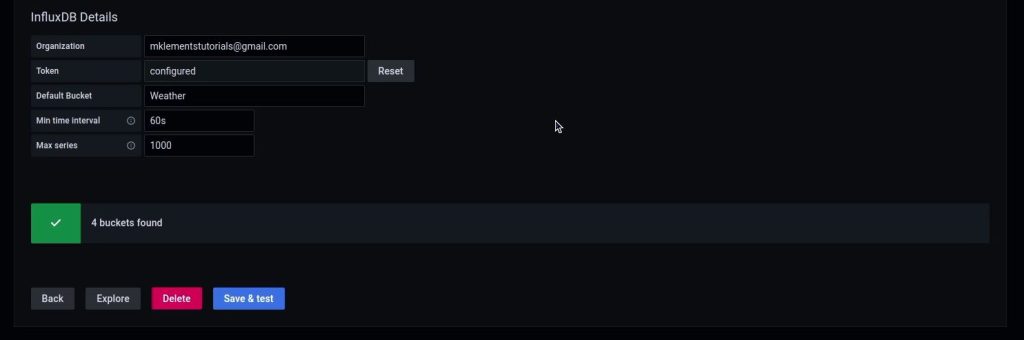
If it has worked correctly then you should get a green tick and it’ll tell you how many buckets have been found.
So that’s great, we can now move on to creating our dashboard.
Creating Your First Dashboard Panel
Let’s go back to our Dashboard’s home page using the menu bar on the left. We can then click on this box on the right side to create our first dashboard.
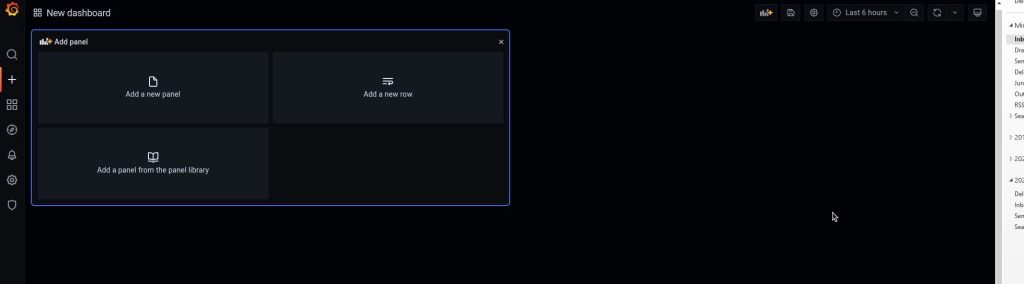
A dashboard is a page that is used to display a set of information. We’re going to create a single dashboard to display our three weather parameters. Each of the graphs or gauges that we want to display can be created in a panel, so let’s create our first graph by clicking on “Add a new panel”.
We then get a page that gives us a number of options to set up what data is displayed and how it is displayed. It might look quite intimidating the first time you land on this page, but it’s quite simple once you get the hang of it.
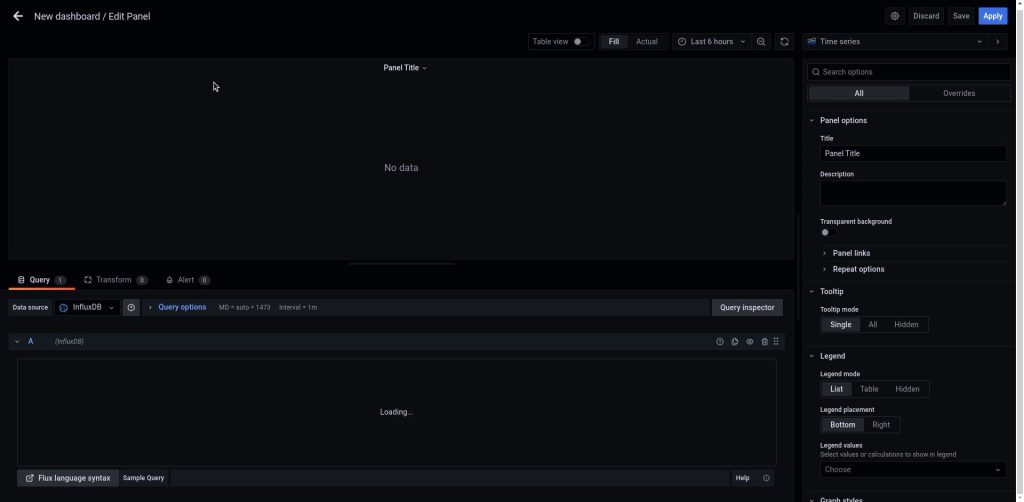
Using the toolbar on the right side you can configure how you want the information displayed, like the title, axis labels and colours. At the top of this section, you can choose the type of visualisation, like a time-series graph or an instantaneous indicator gauge.
Using the toolbar at the bottom, you can configure your database query that selects what information from your database is displayed.
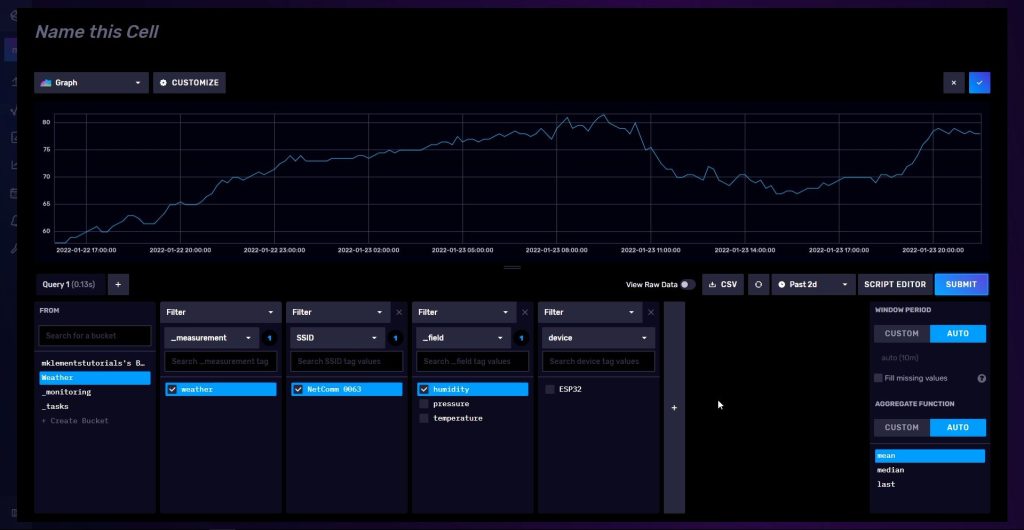
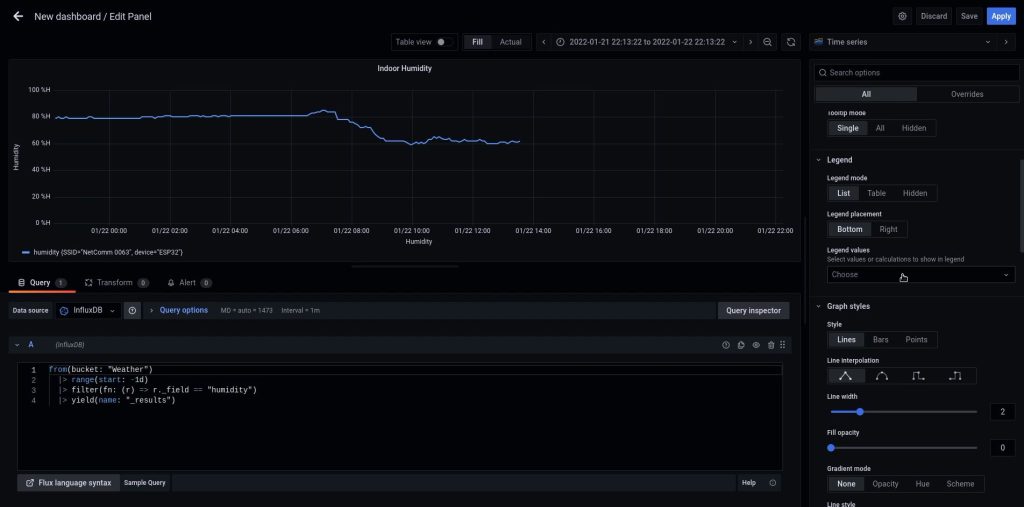
Let’s enter our first query to get the temperature information from our database.

We start by telling it which bucket to read the information from.
We then select the range to look at, we’re going to look at the past day.
We then need to add a filter to tell it which field to look at, we’re going to be using temperature first.
Lastly, we’re going to name the set of data returned as “_results”.
If you click on the graph area, it’ll run the query and you should now see a data trend being displayed as a time-series graph.
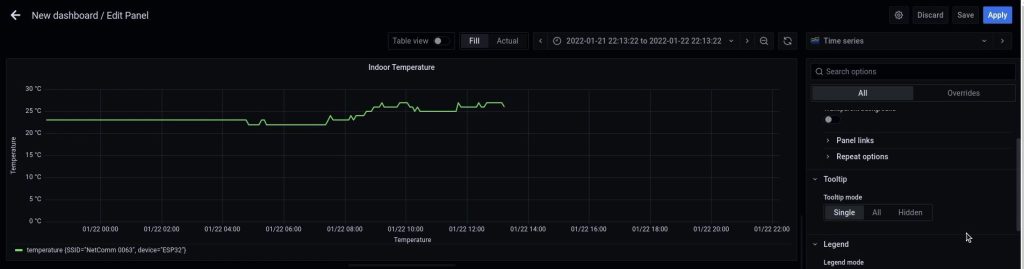
We can then configure how we can this information to be presented by making changes to the graph’s parameters on the right. Try changing each of these fields and see what effect it has on the displayed graph, you can’t really mess it up too much and if you do you can just set it back to the original value or setting.
You can changes things like the title and axis labels, add trend lines and legends, and even change the series colours.
Creating The Rest Of Our Dashboard
Let’s do the same for the humidity and pressure as well.
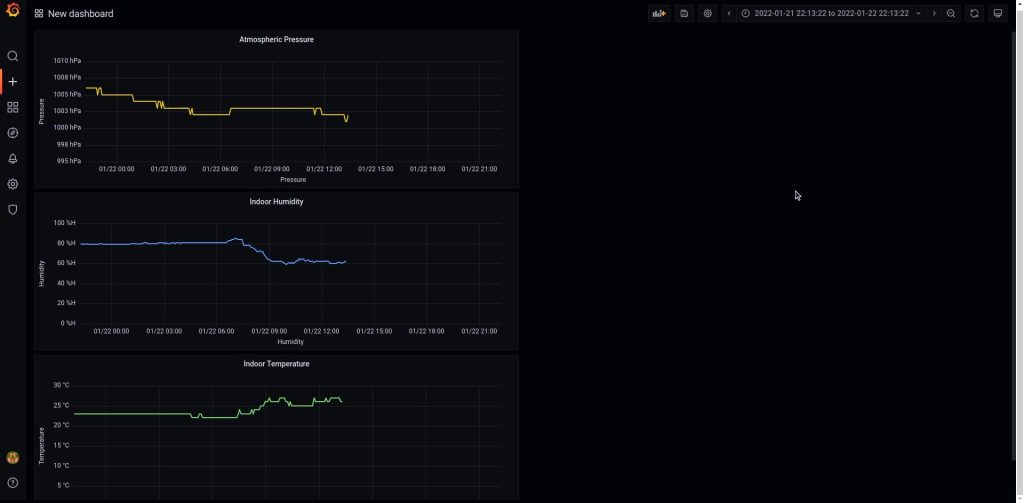
We’ve now got three graphs that show a time-based trend of our data, but it’s difficult to see what the current values are, so let’s create an instantaneous gauge for each parameter by following the same process.
We can use the same query as we’ve done previously but instead of one day, we only need the data recorded in the past 5 minutes as this is how often we’re taking new readings.
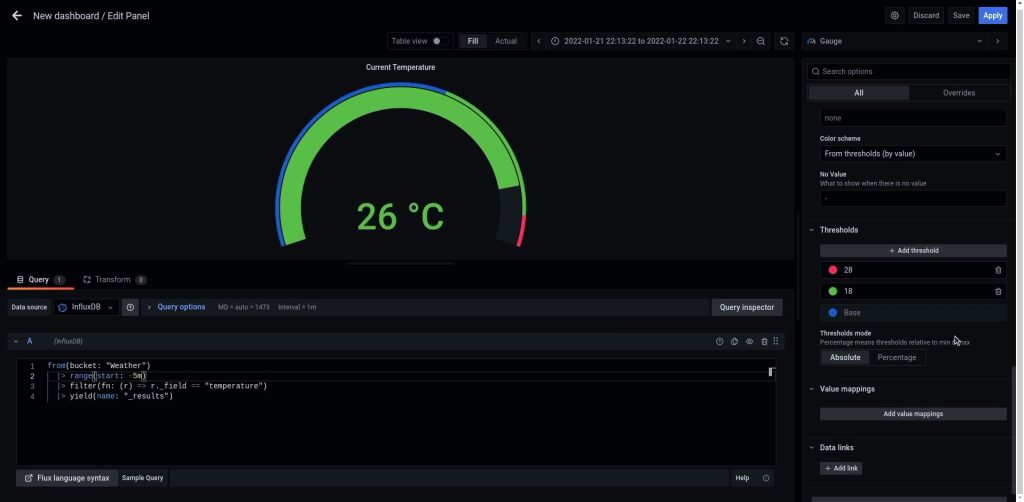
Gauges are quite a useful visualisation tool as you can set up limits and define coloured thresholds or bands showing the normal and extreme conditions for each metric or field.
I’m really just scraping the surface of what you can do with each of these visualizations, so you should definitely read up a bit more about what options are available and try customizing yours further.
The last thing I want to add is a bit more information on the high, low and average values for the past 24 hours. We can do this quite easily by adding these values to each graph’s legend.
Search for each value in the text field, or select them from the drop-down list. I’m also going to change the legend mode to Table rather as I prefer the way this presents the values.
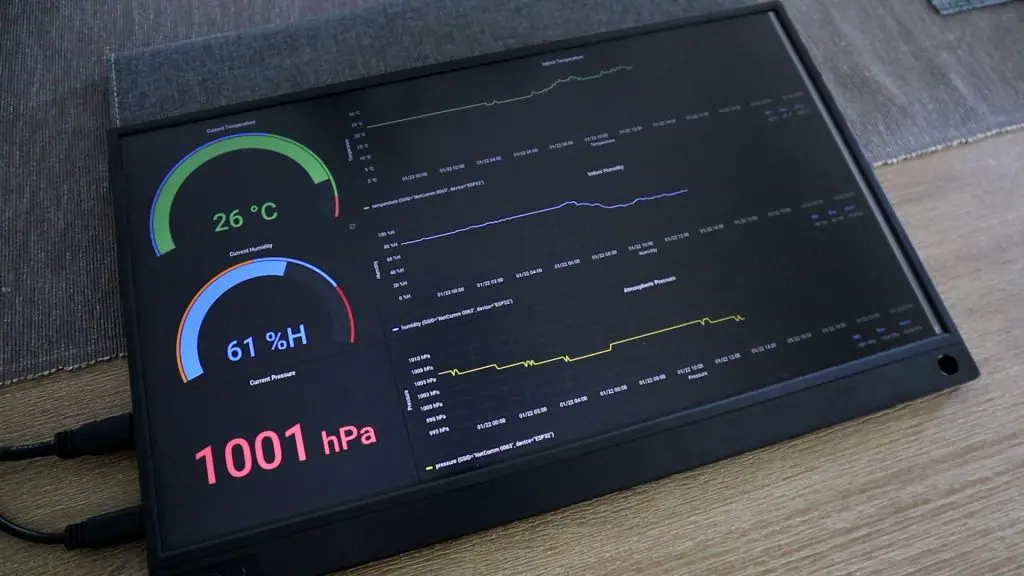
Resizing The Dashboard To Run In Fullscreen Mode
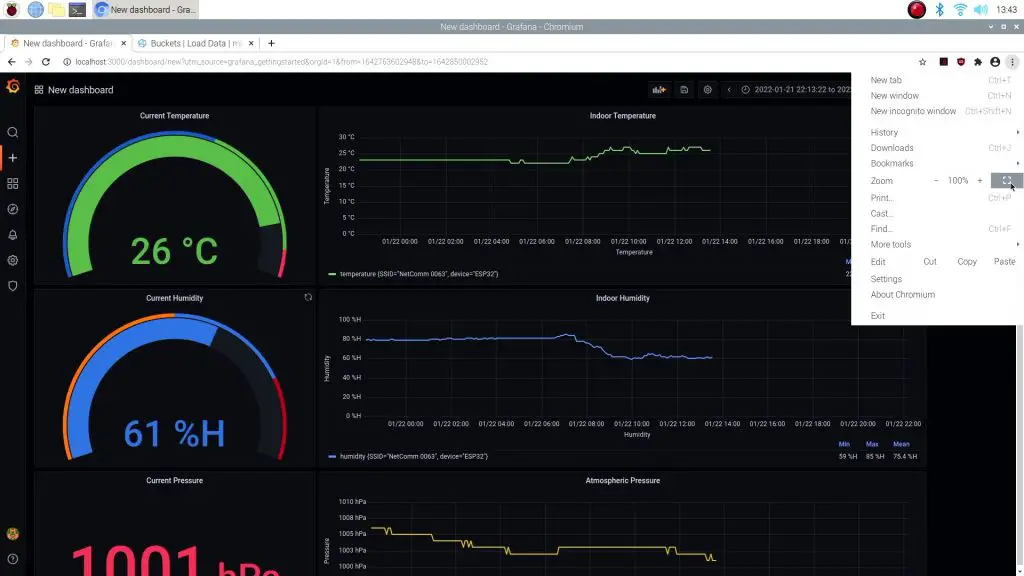
This dashboard looks fine if we’re viewing it on the web, but if we want to use it on something like a touch display, then we don’t want the browser and toolbars to be visible, we just want to see the information on the dashboard.
We can do this by first hiding the taskbar and browser toolbars by setting the browser to fullscreen mode.
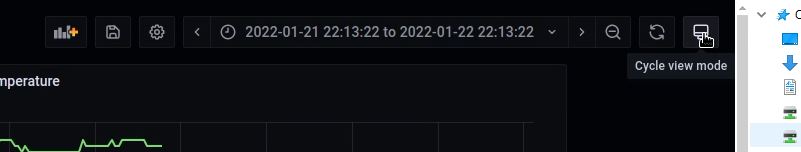
Then we can hide the Grafana toolbars by cycling the view mode using the icon in the top right.
We can also then re-size the panels to suit the fullscreen mode on our device.
That’s it, we’re now done creating our first Grafana dashboard from data that we’re recording to InfluxDB using our own sensors and microcontroller.
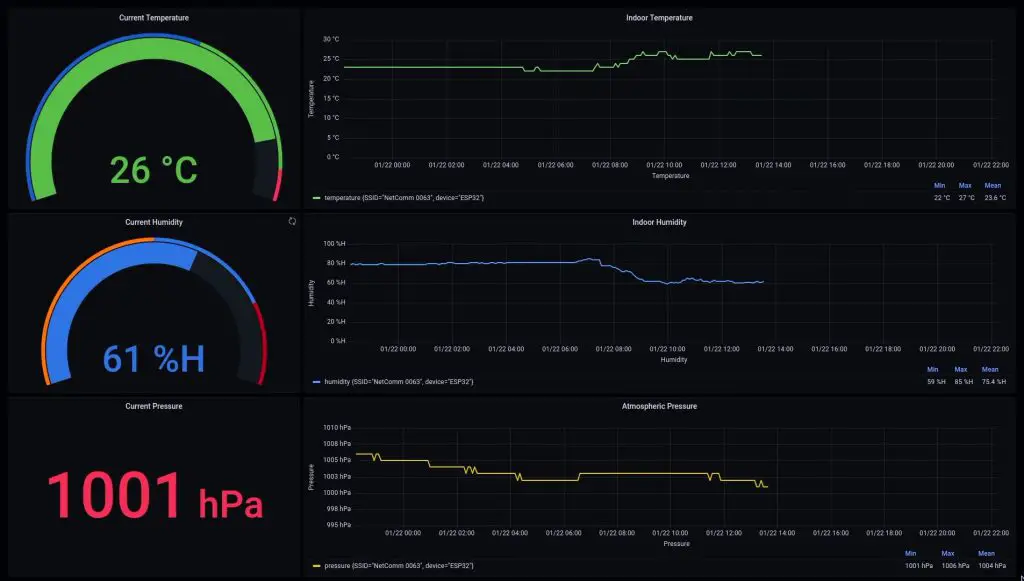
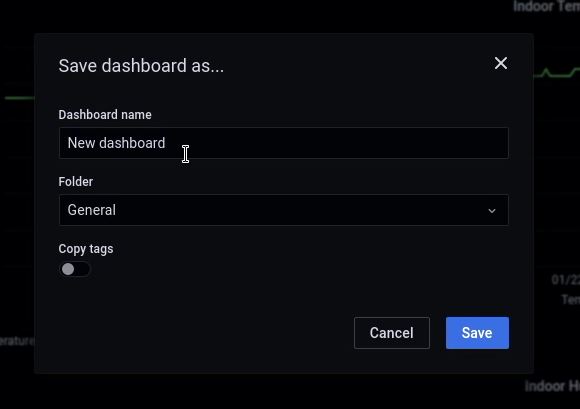
Remember to save your Dashboard before exiting or leaving it running.
This is a really basic example. There are loads of tools and plugins available to create really powerful graphics and trends, so do a bit of reading up on them and try creating some unique ones for your data.
I hope this tutorial was helpful, let me know what you’re going to be using your new Grafana dashboard to monitor in the comments section below.
Excellent Write-Up!!!!
Thanks for the great tutorial!!!
Hey,
Nice tutorial, congratulations!
How can I learn about runnig influxdb on my raspberry pi 4?
Thanks
There is quite a bit of documentation on the InfluxDB website, I found this quite helpful when starting out.
hey that is exactly what i was searching for… great thank you Michael.
But i got a question: i want to have it local, but i have multiple LANs with isolation and stuff.. is it possible to make a direct connection from the sensor to the Pi without going over the router?
That exceeds my knowledge about networking, maybe you can help me?
Thanks in advance
hi can i run grafana in windows PC
This sounds like an awesome project! I’m curious how you managed to get the ESP32 to communicate smoothly with the sensors. I once had a bit of a struggle getting my Arduino to play nice with some sensors. Also, how did you decide on using Grafana over other data visualization tools? Any tips for someone new to setting up a weather dashboard like this? 😃
Sounds like a cool project! I’ve used Arduino before, but never ESP32. How does it compare in terms of ease of programming for sensor readings?