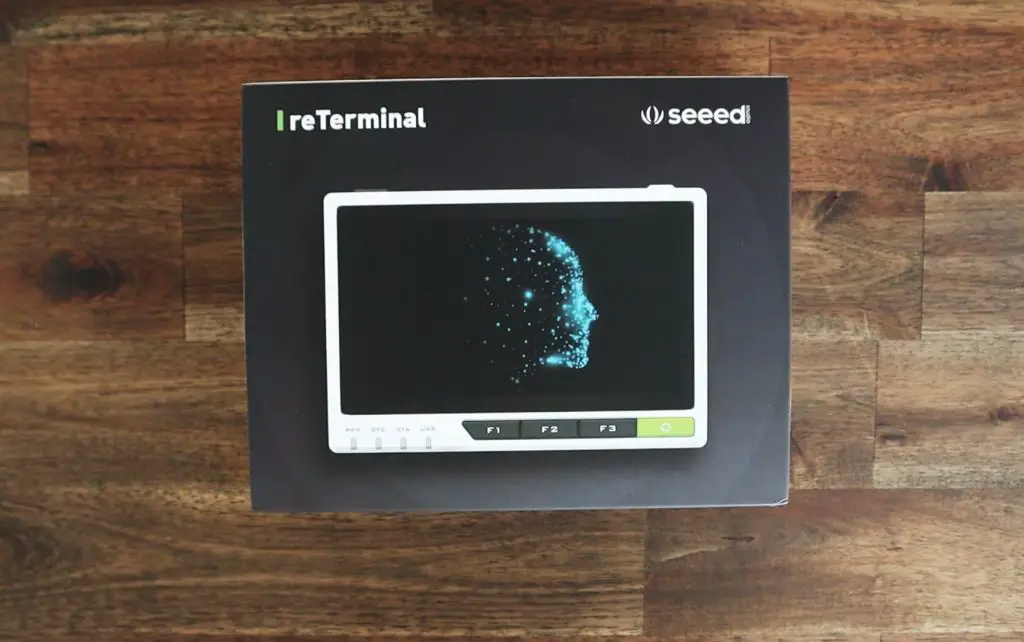
Today we’re going to be taking a look at the reTerminal, by Seeed Studio. We’ll unbox the device to see what is included and we’ll then set up a weather dashboard on it using Grafana. We’re going to use weather data that is being recorded by an ESP32 microcontroller and is being posted to an InfluxDB database.
The reTerminal is a compact HMI (human-machine interface) device that is powered by a Raspberry Pi compute module 4 (CM4). It has a 5″ capacitive touch display, along with four physical function buttons, some status LEDs, and a host of IO options.
Watch my unboxing and setup video, or read on for the write-up:
Where To Buy Your Own reTerminal
You can pick one up from Seeed studio’s online store or from Amazon;
reTerminal (Seeed Studio) – Buy Here
reTerminal (Amazon) – Buy Here
Other components used for the Grafana dashboard;
Power Supply – Buy Here
ESP32 – Buy Here
Grove Sensor’s From Beginner Kit – Buy Here
Breadboard – Buy Here
Breadboard Jumpers – Buy Here
Unboxing The reTerminal
The reTerminal is shipped in a white box with a sleek matt black sleeve around it. The box is a little smaller than the display area of an iPad and is about 5cm thick.
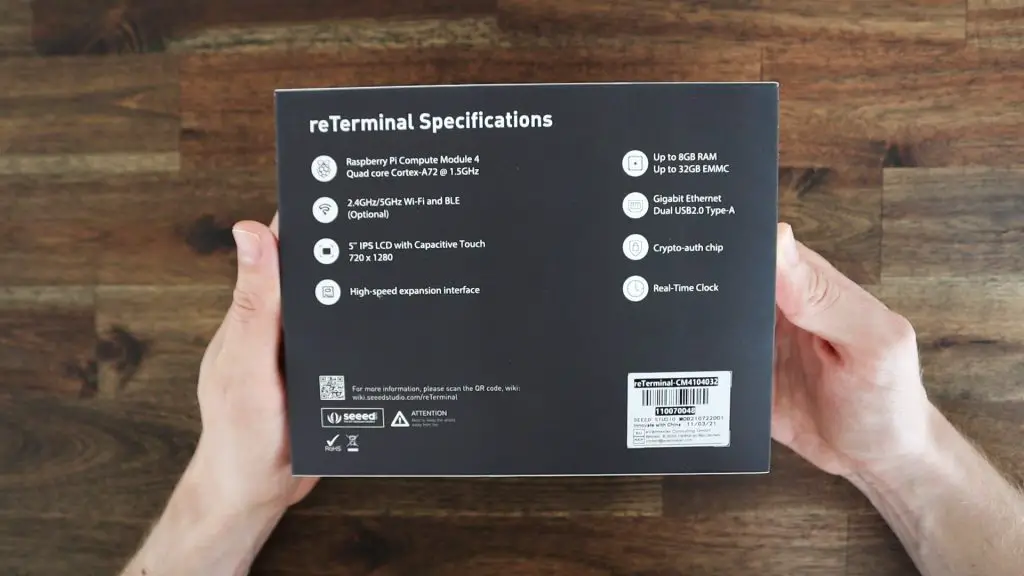
It comes standard with a 4GB WiFi variant of the Raspberry Pi Compute Module 4, running a quad-core Cortex-A72 CPU, and has 32GB of built-in eMMC storage.
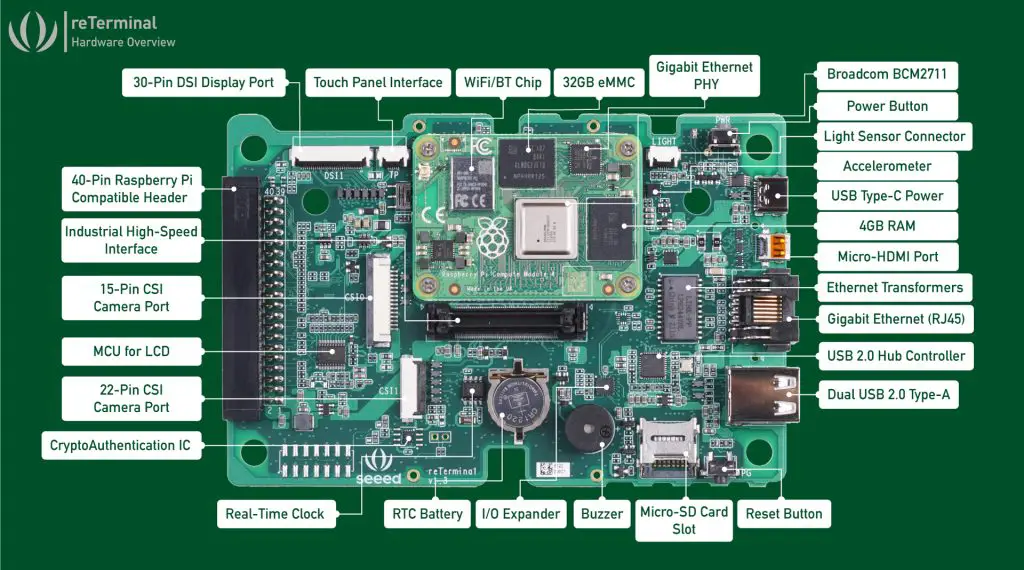
It features dual-band, 2.4GHz/5GHz WiFi and Bluetooth 5.0, Gigabit Ethernet, Dual USB 2.0 ports, and a crypto-auth chip. It also has a built-in accelerometer, light sensor, and real-time clock.
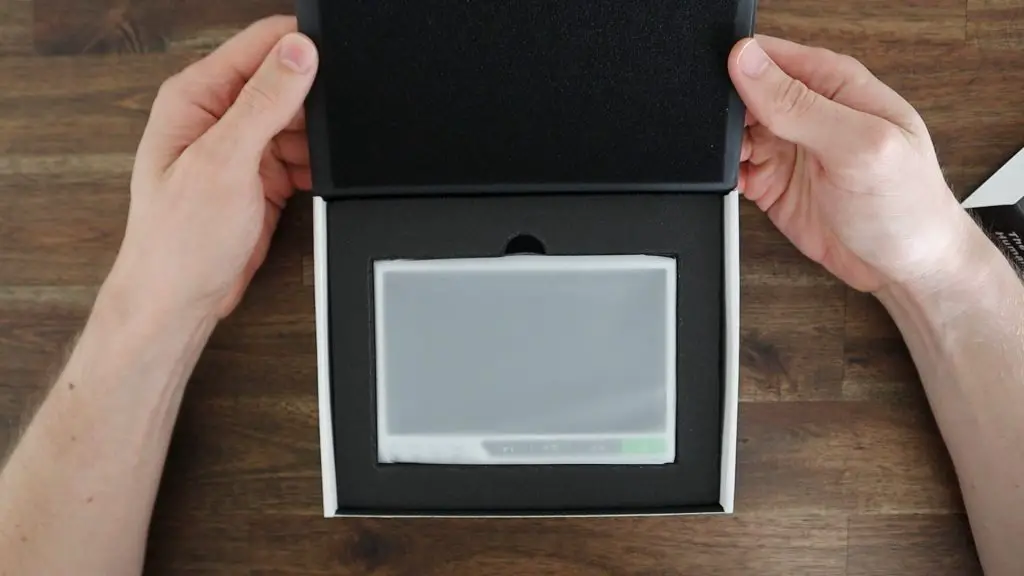
The reTerminal is packaged in a protective sleeve and is surrounded by dense back foam.
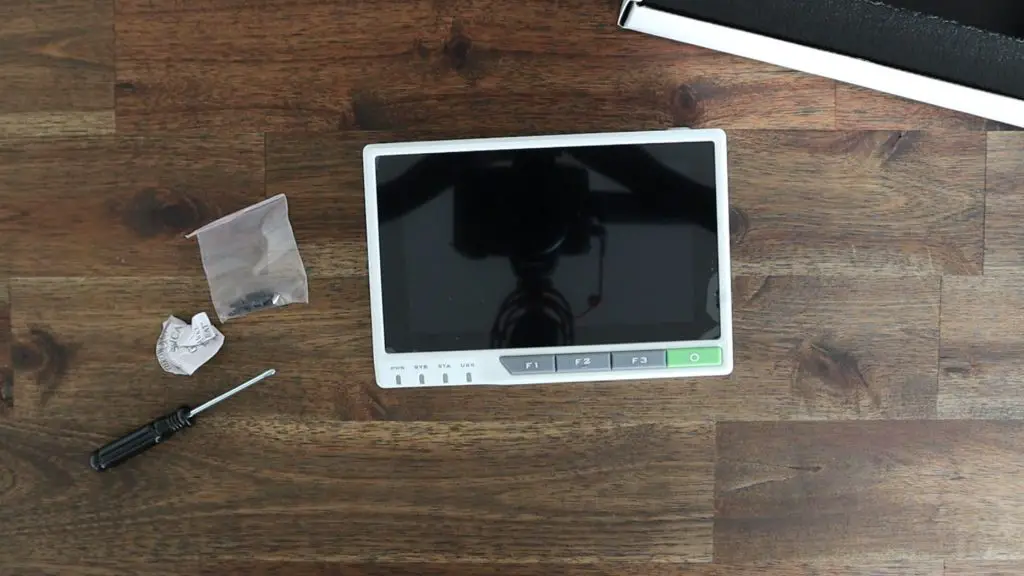
In the box, you get the reTerminal, a small pack of mounting screws, and a small screwdriver. There isn’t a manual or datasheet in the box, but there is quite a lot of information available on their product page and the reTerminal wiki.
First Look at the reTerminal
The reTerminal is a bit smaller than what I was expecting but also feels like a much better quality product than I had anticipated. It is quite dense and feels solidly put together, with good quality materials.
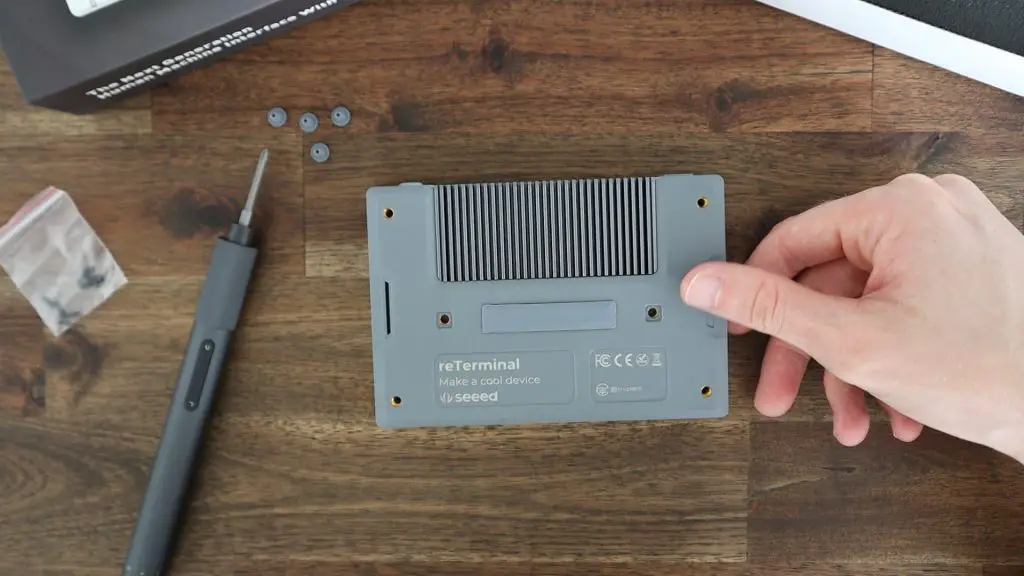
On the bottom, we’ve got a 1/4″ camera mount and a small hole to access the reset button on the left side.

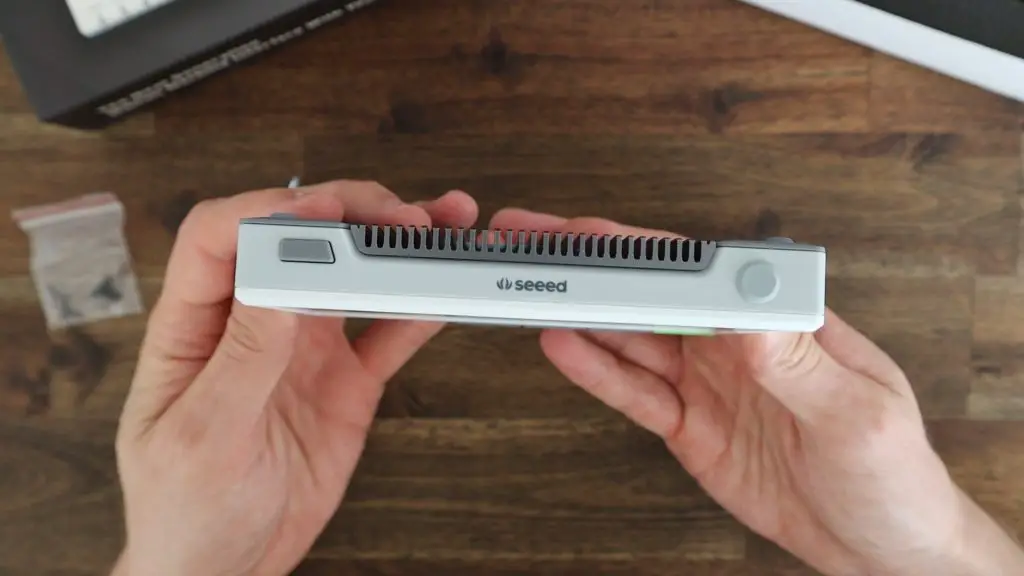
Along the top is a power button to the left, used to turn the reTerminal on again once it has shut down, a large aluminium heat sink along the back for the CM4 module, and a threaded mounting point on the right.
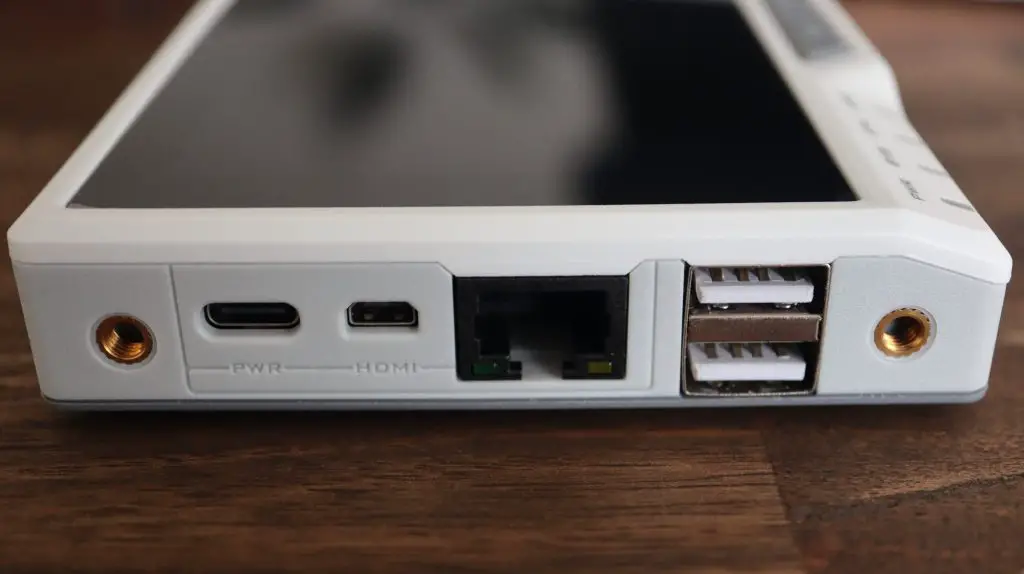
On the left side, we’ve got a USB C port for power, a micro HDMI port, Gigabit Ethernet, two USB 2.0 ports, and two M4 threaded mounting points.
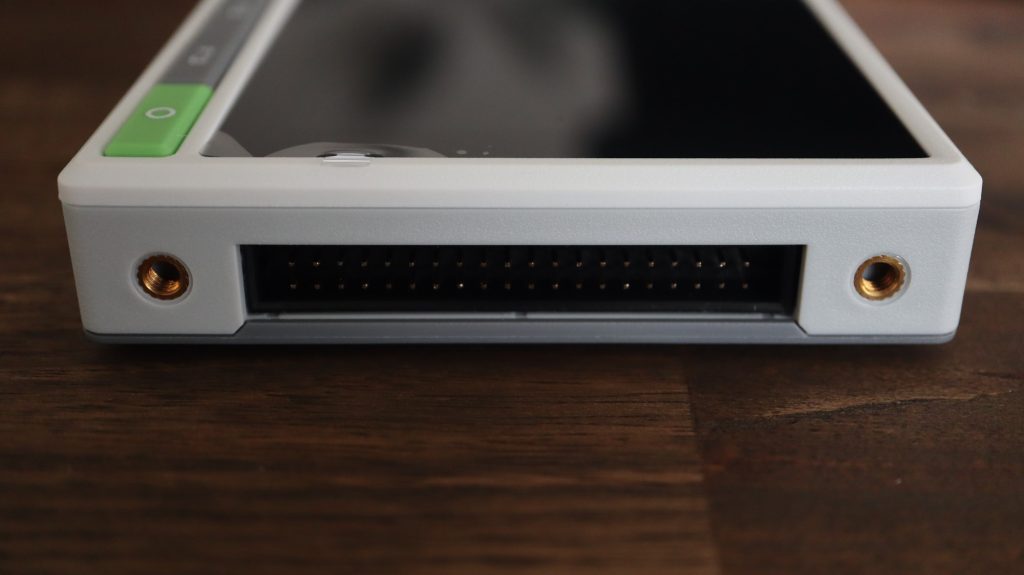
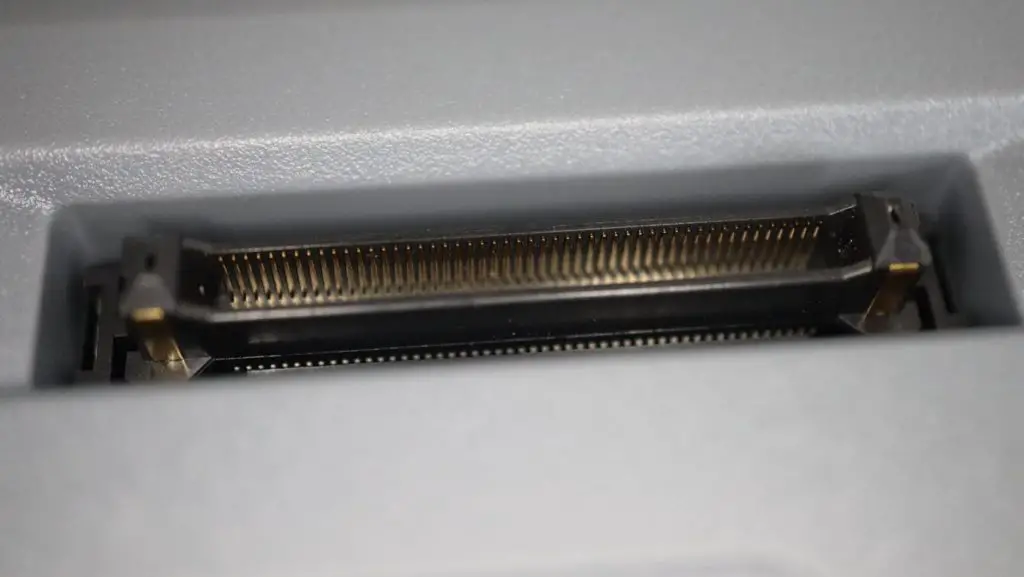
On the right side, we’ve got a 40 pin GPIO header that has the same pinout as the other Raspberry Pi boards which is great for interfacing with sensors and expansion modules. We’ve also got another two M4 threaded mounting points.
On the back of the reTerminal we’ve got the large heatsink, two more threaded mounting points, a slot for the camera connector ribbon cable, and under a dust cover, a high-speed PCIe Gen 2 lane.

Let’s Take A Look Inside The reTerminal
I’m not sure if the screwdriver is meant to be used for the mounting screws or to open it up, but we’re going to open it up anyway to take a look at what is inside the reTerminal.
First, we need to remove the 4 rubber feet/plugs that cover the screws securing the back plastic cover.
One thing the reTerminal is not short of is mounting points. There are literally threaded mounting points on almost every side of the device, so you won’t have any issues securely mounting it for a project.
Removing the first cover and heat sink allows you to access the boot switch to re-flash the operating system on the Compute Module’s eMMC storage.
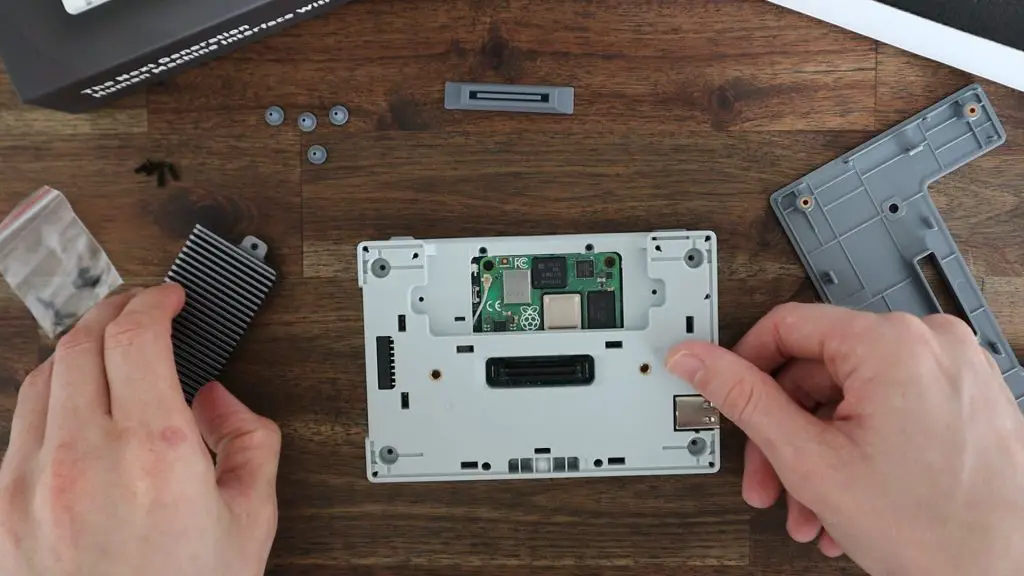
Removing the second cover exposes all of the remaining electronics.
The Pi 4 Compute module, can be replaced if you’d like, but I think they’ve chosen a good variant to ship with. You might want to go with the 8GB variant if you’re going to be doing a lot of multitasking or running more resource-intensive applications, but that seems unlikely on a device like this.

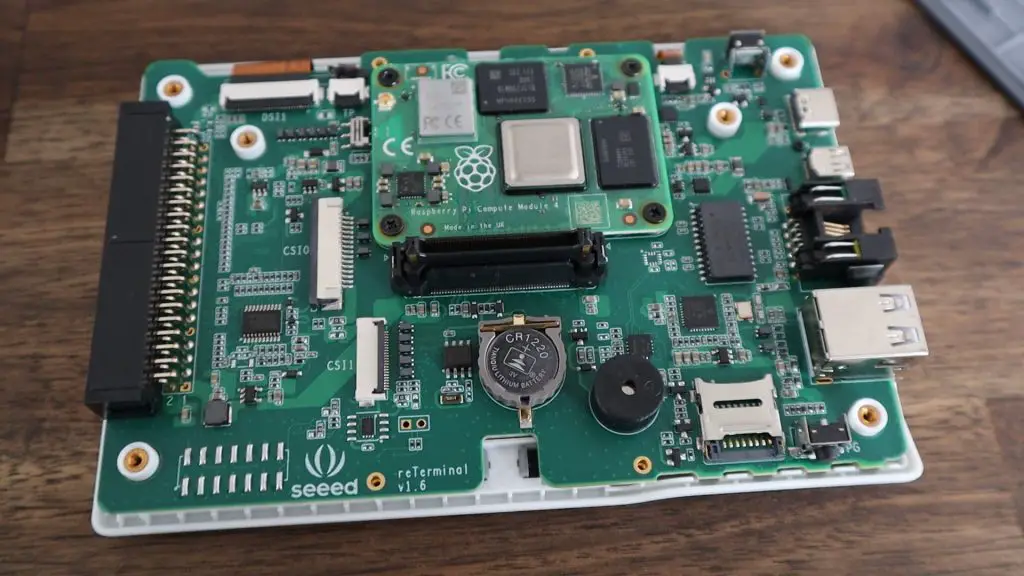
On the board, some of the main features we’ve got are 15-pin and 22-pin camera ports, a 30-pin display port, a microSD card slot, a real-time clock module and a cryptographic co-processor with hardware-based key storage.
All of the electrical schematics are also available in their documentation.
This is version 1.6 of the board in my reTerminal.
Let’s close it back up and turn it on.
Booting Up The reTerminal
The reTerminal comes with Raspberry Pi OS Buster pre-installed, so when you power it up the first time, you’ll need to go through the usual first boot setup process.
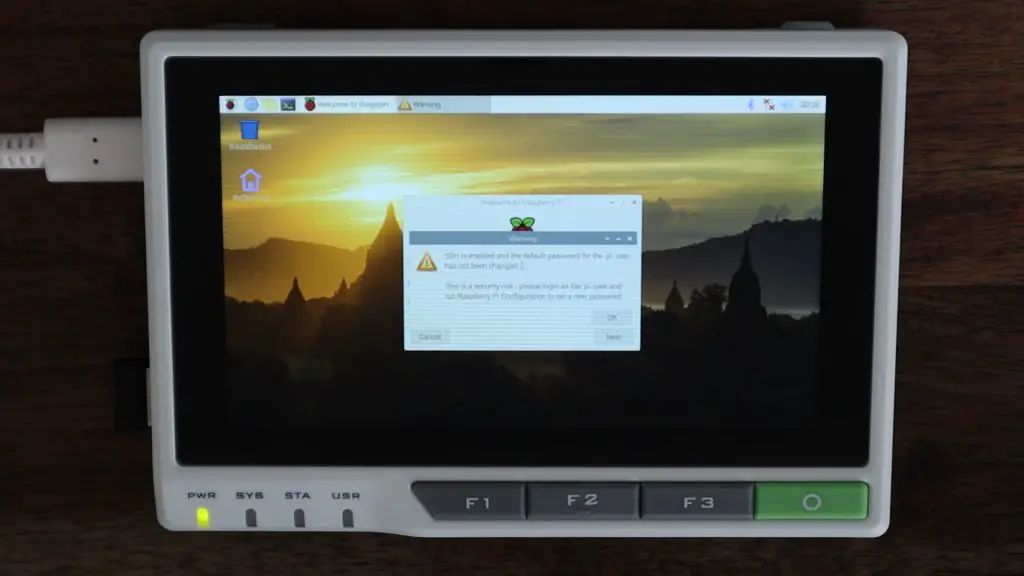
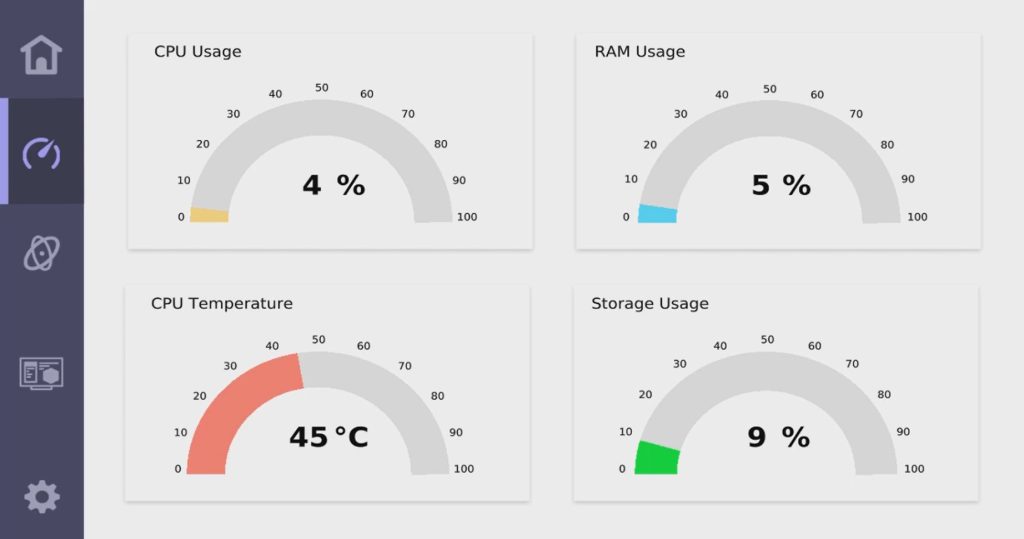
It also comes preloaded with a reTerminal demo app, which just shows some of the basic functionality and use cases for the device.
The touch display is really responsive and is quite accurate for its size. As I’ve mentioned in previous reviews, like my review of the RasPad 3, Raspberry Pi OS itself isn’t the greatest for use with a touch display as the icons land up being really small and quite difficult to touch accurately. But if you’ve going to build your own dashboards and interfaces, which is the point of the reTerminal, then you have the opportunity to make the icons a bit bigger and these should work well.
Creating A Grafana Dashboard
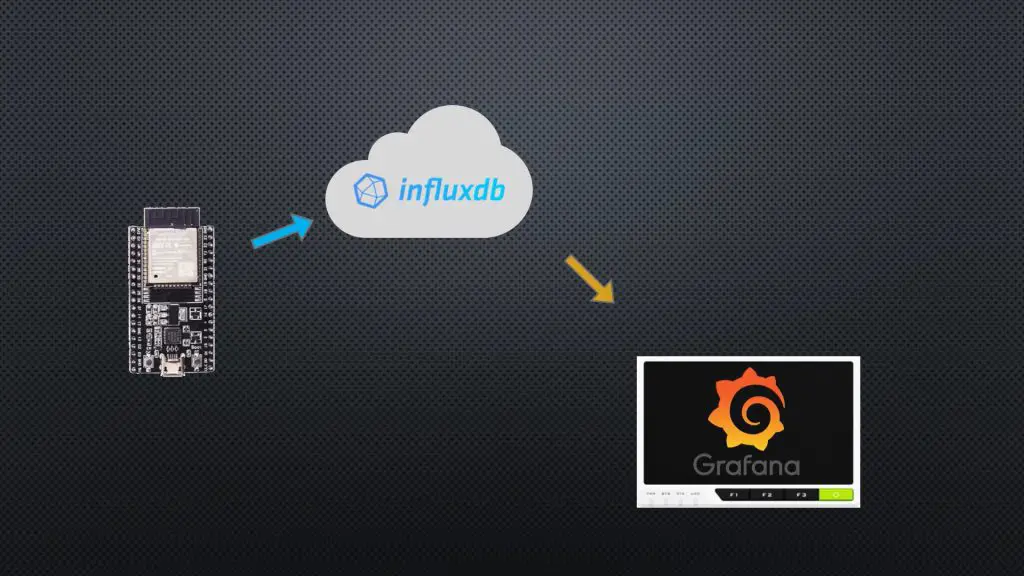
I’m going to use an ESP32 to collect temperature, humidity and pressure readings. These will then be posted to a time-series database in InfluxDB. Influxdb can be run locally on a Raspberry Pi or on their cloud server, we’re going to be using their cloud server. We’re then going to be using an analytics and visualisation application called Grafana to display the information that has been stored in the database. Grafana can also be run locally on our Raspberry Pi (or reTerminal in this case) or on their cloud server. We’re going to be installing and running it locally on our reTerminal. You don’t need to use a separate Pi for influxdb and Grafana, you could run both locally on your reTerminal if you’d like to – I just don’t want to have to leave the reTerminal running all the time in order to collect the data.
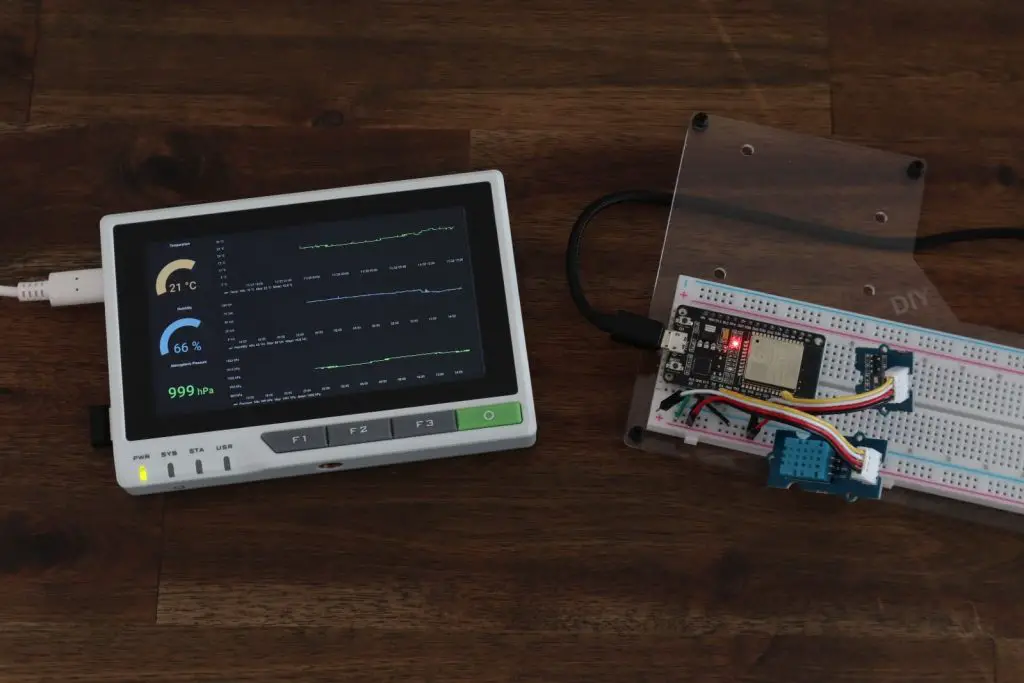
Collecting The Weather Data Using an ESP32 And Posting To InfluxDB
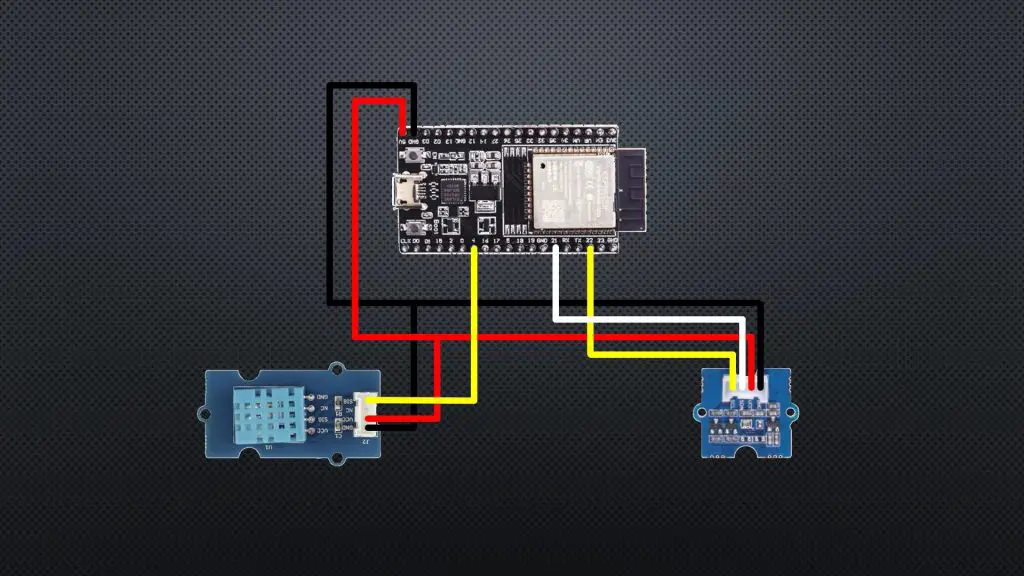
To collect the weather data, we’re going to be using an ESP32 with a DHT11 sensor connected to pin 4 and a BMP280 pressure sensor connected to the I2C interface (pins 21 and 22). I’m using two Grove sensor modules from the beginner kit as they already have all of the required electronics built into them (additional resistors etc.).
I’ve written up an Arduino sketch based on the InfluxDB interface instructions to read in the sensor values and post the data to InfluxDB every 30 seconds.
You can download a copy of the code from my GitHub repository.
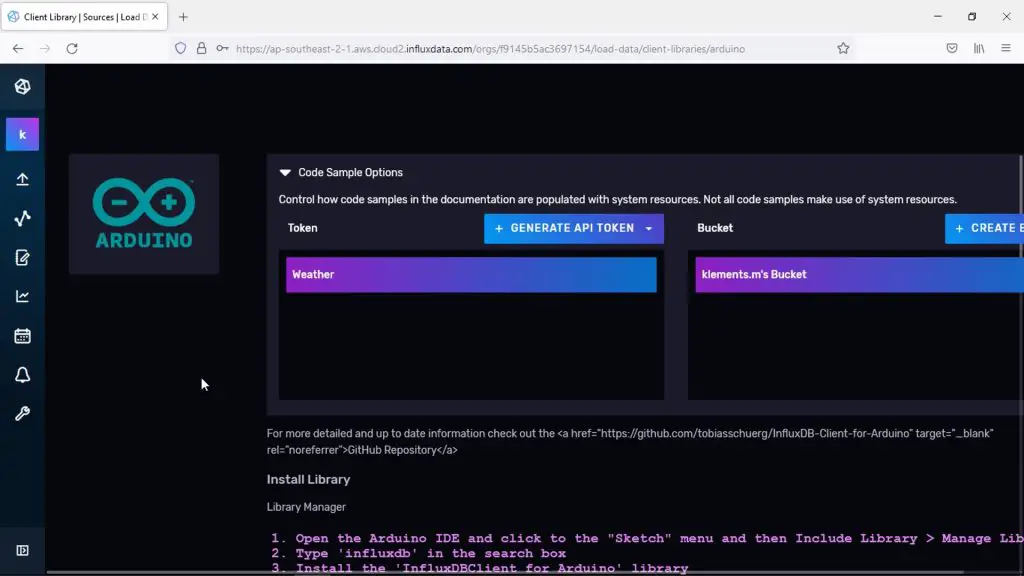
If you set up your API token and bucket, the generated code on the Arduino interface page accessed from your InfluxDB dashboard will already contain the correct setup information, so you just need to copy it into your code.
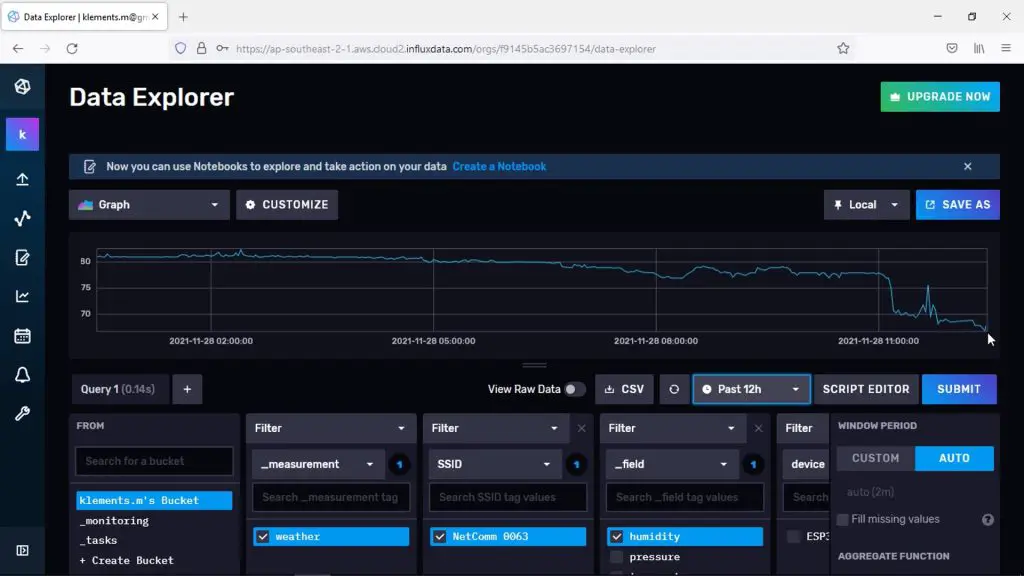
After a while, we can see that the information is now available in our InfluxDB database, so we know that our ESP32 is working correctly.
So we can now move on to installing Grafana on our reTerminal and setting it up to display the information in our database.
Installing and Setting Up Grafana On The reTerminal
Next, we’re going to install Grafan by following the terminal instructions outlined on their website for an installation on Debian or Ubuntu.
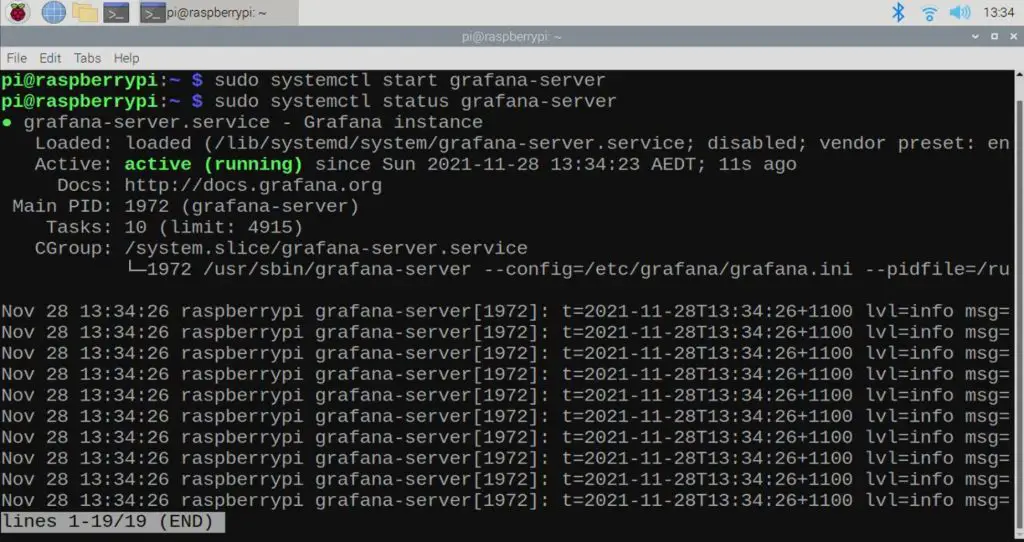
Then we just need to start Grafana and set it to re-start on bootup.
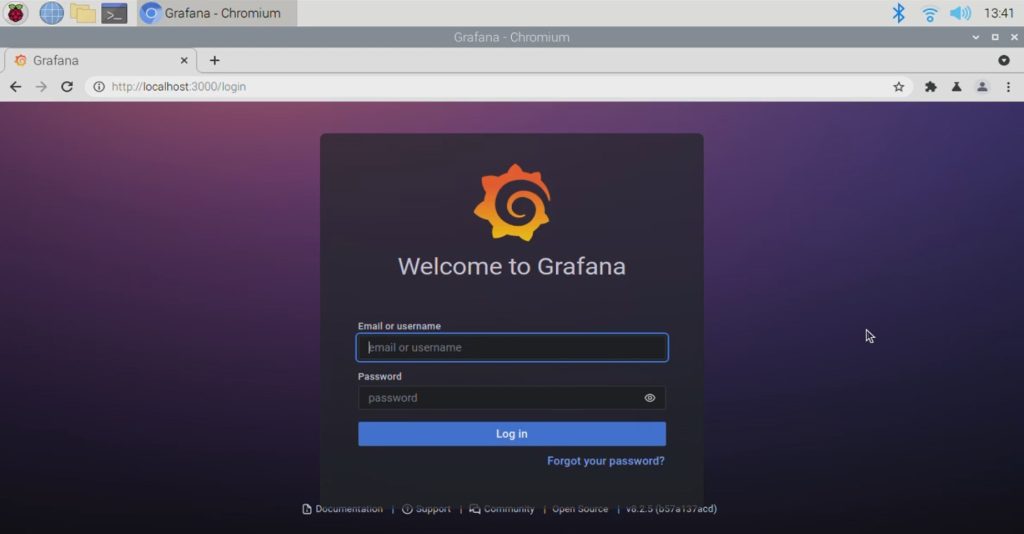
We can then access the Grafana web interface by opening up a new tab in our browser, pointing to localhost, port 3000.
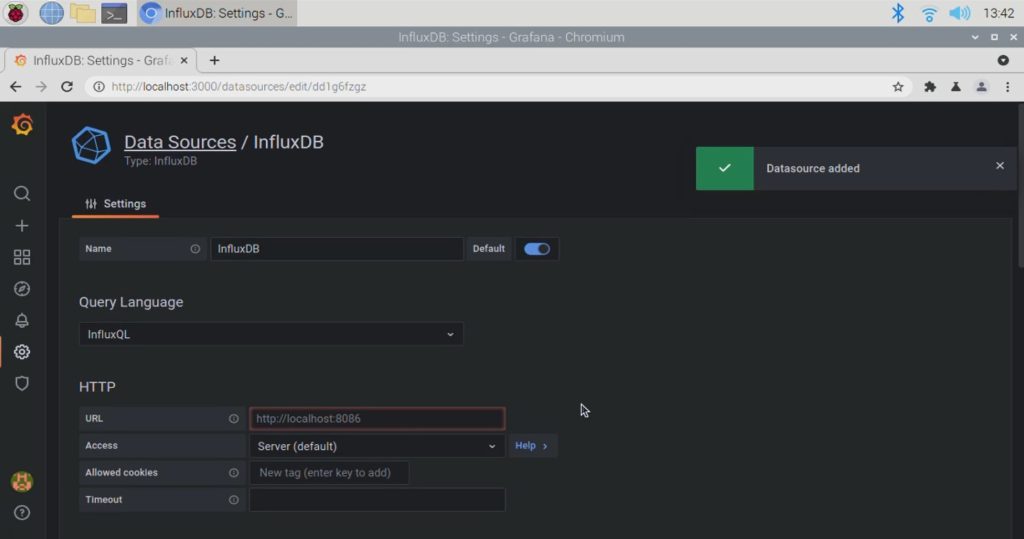
We then need to configure it to read in the data from InfluxDB by entering the sever and authentication information. This can all be found through your InfluxDB web interface and is quite similar to the information your ESP32 is publishing data to.
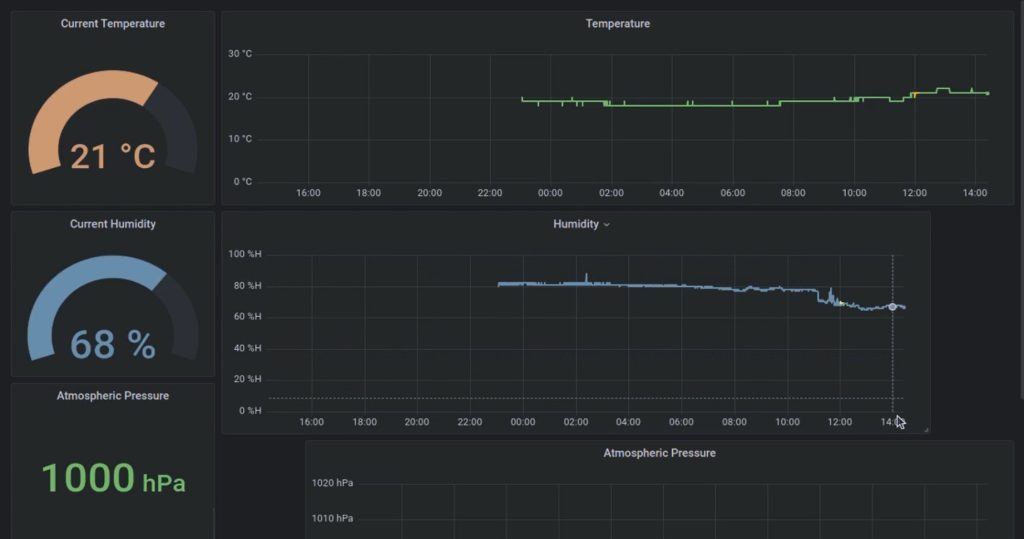
Once that is done we can start building our dashboard by creating panels. Each panel is essentially a graphic, gauge or other graphic which uses a query to pull information from the database. You can then customise the appearance of each panel through a number of settings and optional plugins.
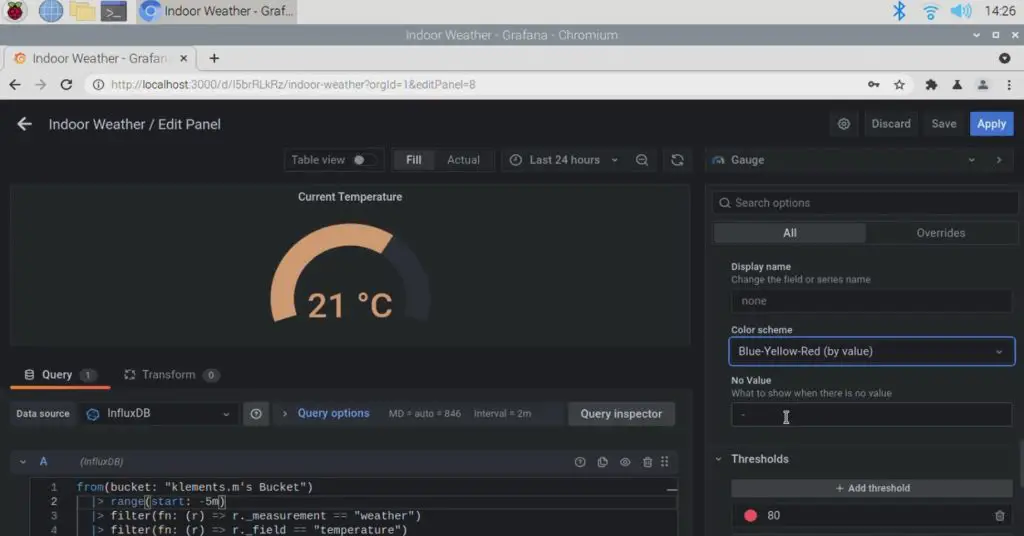
Im going to set up a gauge and historic trend for each of the three metrics.
I’ll also set each trend to display the minimum, maximum and mean or average value recorded for the time period.
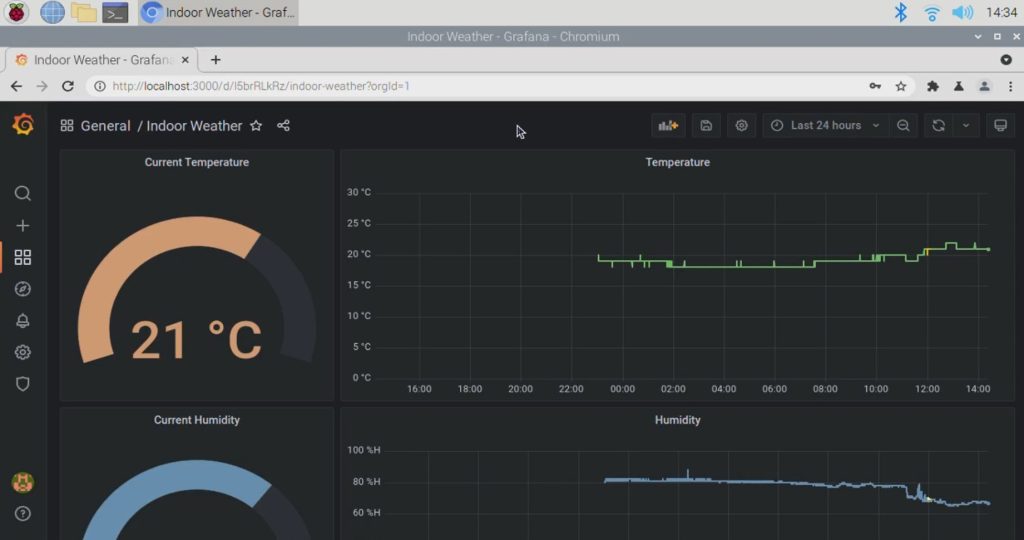
Grafana gives you a lot of options for building dashboards and is a really powerful visualisation tool for your data.
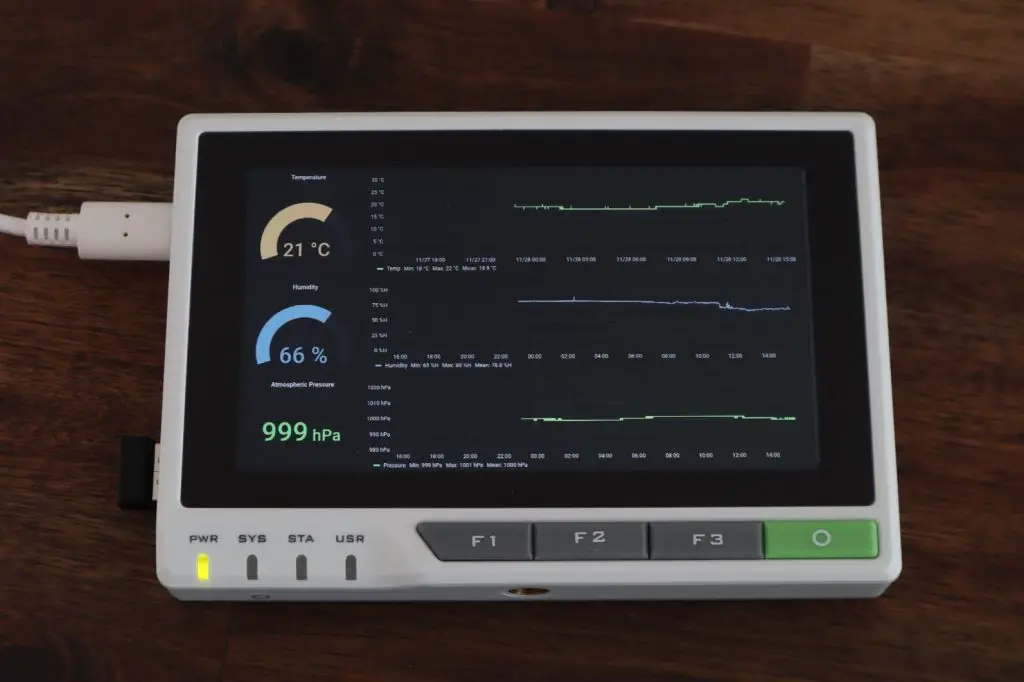
Now it still looks like a web page on our reTerminal, so to get it to fill the complete screen, we set the browser to fullscreen mode by selecting the three dots in the top right and selecting fullscreen mode next to zoom. We then also need to cycle the view mode in Grafana by clicking on the monitor icon in the top right corner.
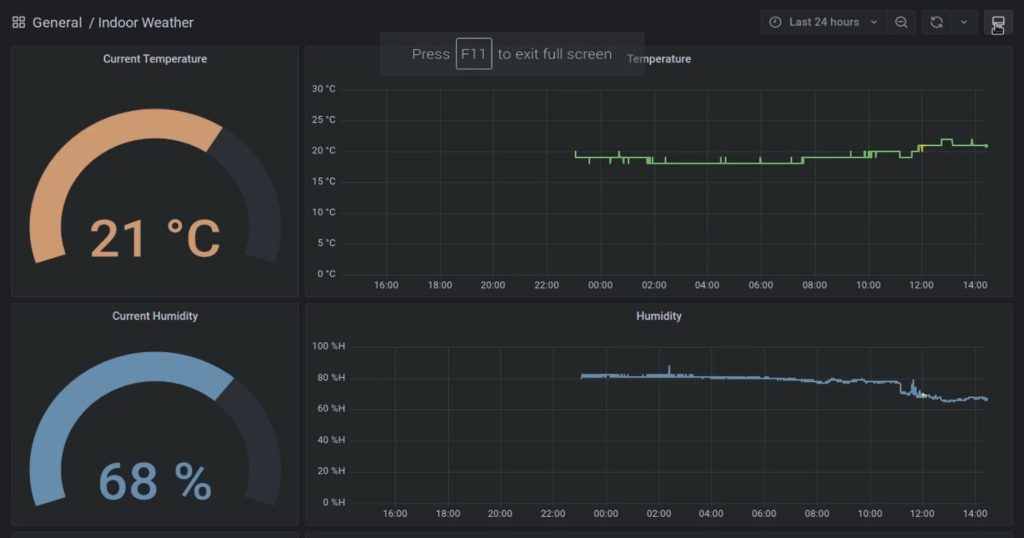
Now lets just resize the panels to fit onto the single fullscreen display.
And now we’ve completed our basic dashboard. If you’ve got a lot of data, it would be great to add multiple tabs to your dashboard and use the buttons on the reTerminal to cycle between them.
If you guys would like me to go through the setup of InfluxDB and Grafana step by step, let me know in the comments section.
Also, let me know what you think of the reTerminal, and be sure to check out their product page.
Seeed Studios sent me this reTerminal to review and share with you, but I was not paid to review or endorse the product.
Thank you for this detailed explanation of a great application!
If I understood this correctly you chose to physically install Grafana on the Pi. What would be the advantages and disadvantages of accessing Grafana online versus installing it on the reTerminal here?
Kind regards,
M