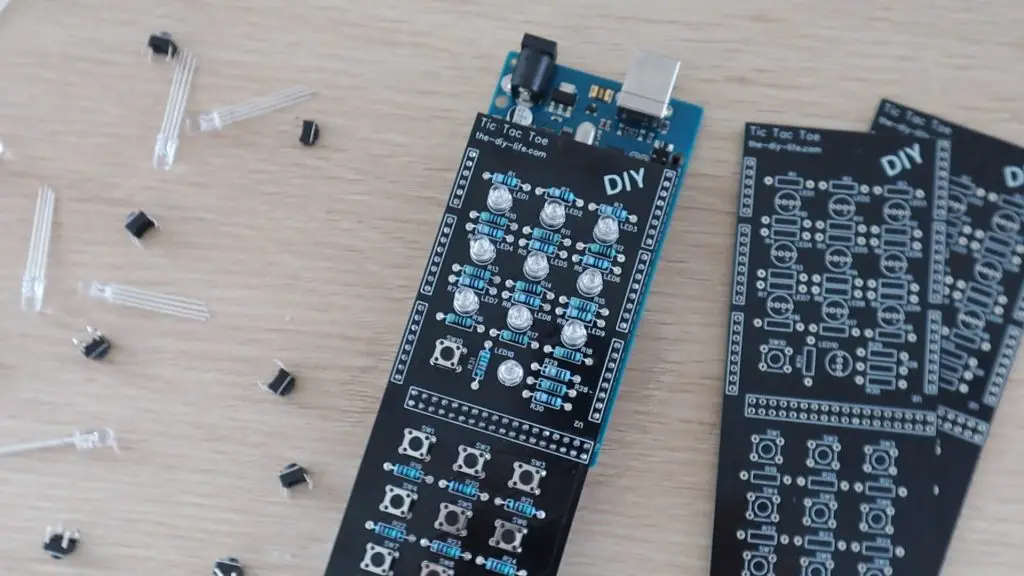
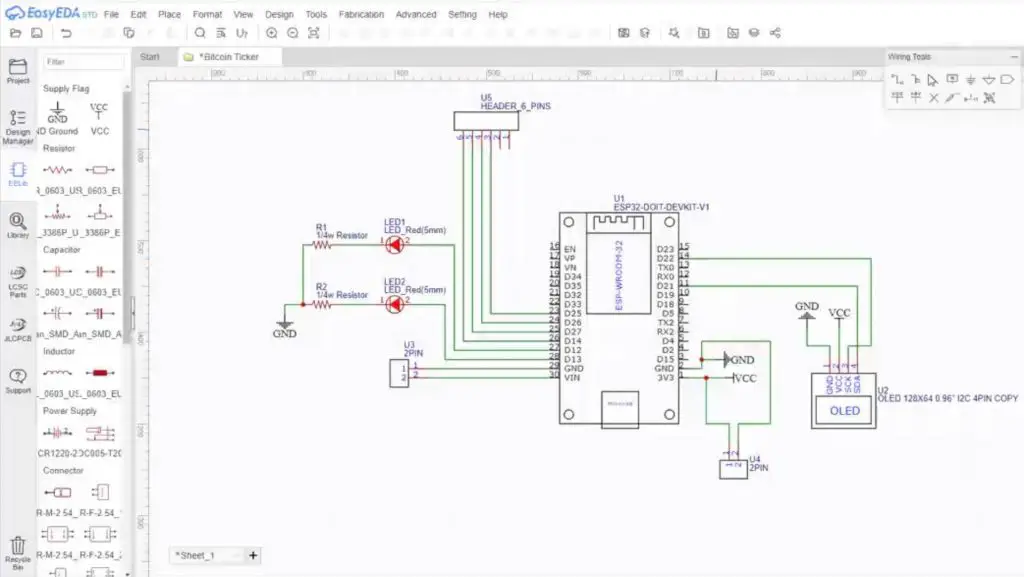
Today we’re going to be building a mini Raspberry Pi server with a built-in UPS and OLED stats display. A Raspberry Pi makes a great server for a NAS or for media streaming, home automation, or even a home security hub for your cameras. All of these projects would benefit from having a built-in UPS to ensure that the Pi is kept running in the event of a power interruption.
Here’s a video of the build and the UPS running, read on for the full write-up. You can also buy a case kit, which includes all of the components you need to assemble your own mini server.
What You Need To Build Your Own Mini Server With UPS
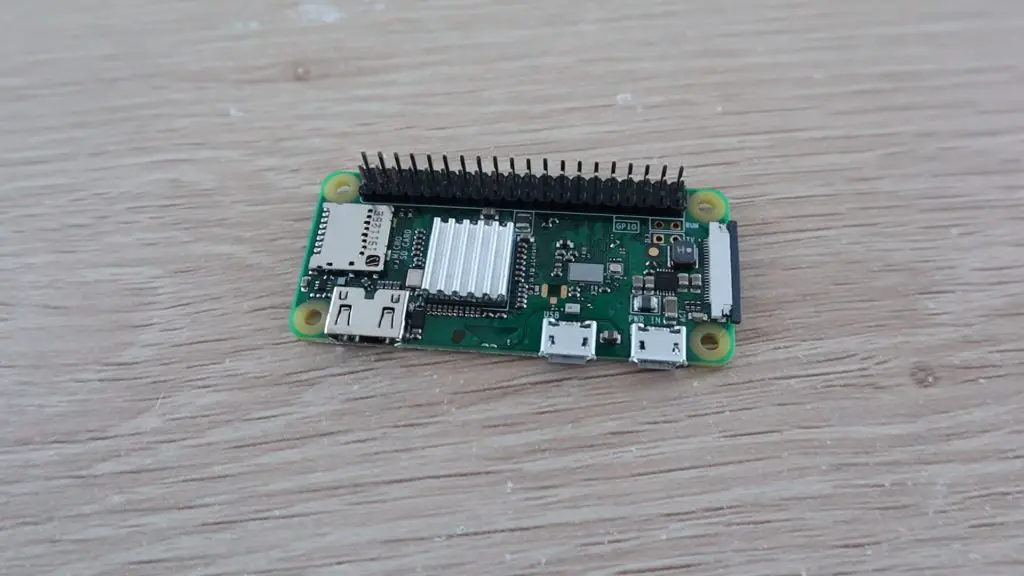
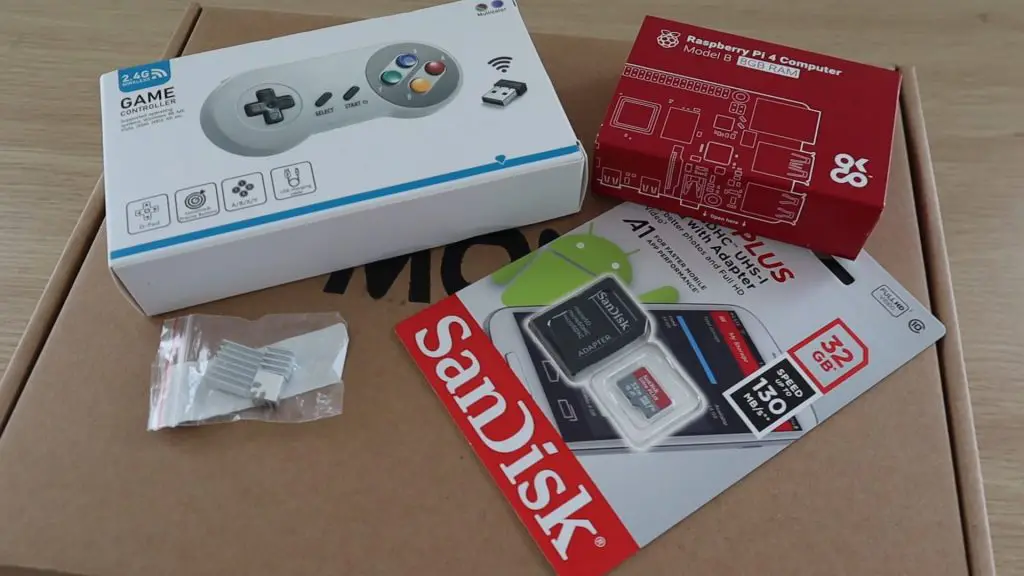
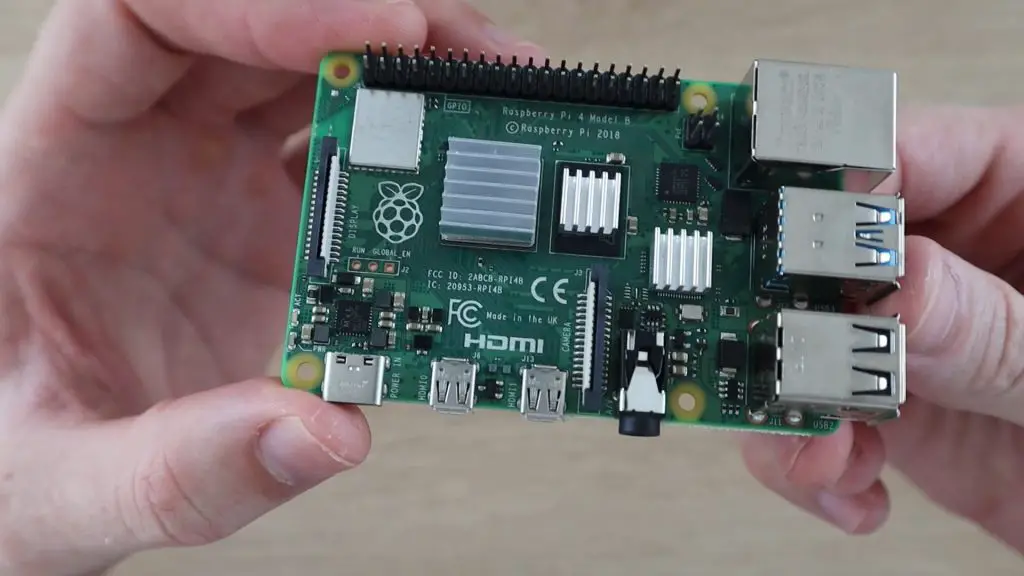
- Raspberry Pi 4B – Buy Here
- 32GB Micro SD Card – Buy Here
- UPS Module – Buy Here
- Low Profile Ice Tower – Buy Here
- 18650 Lithium-Ion Cells – Buy Here
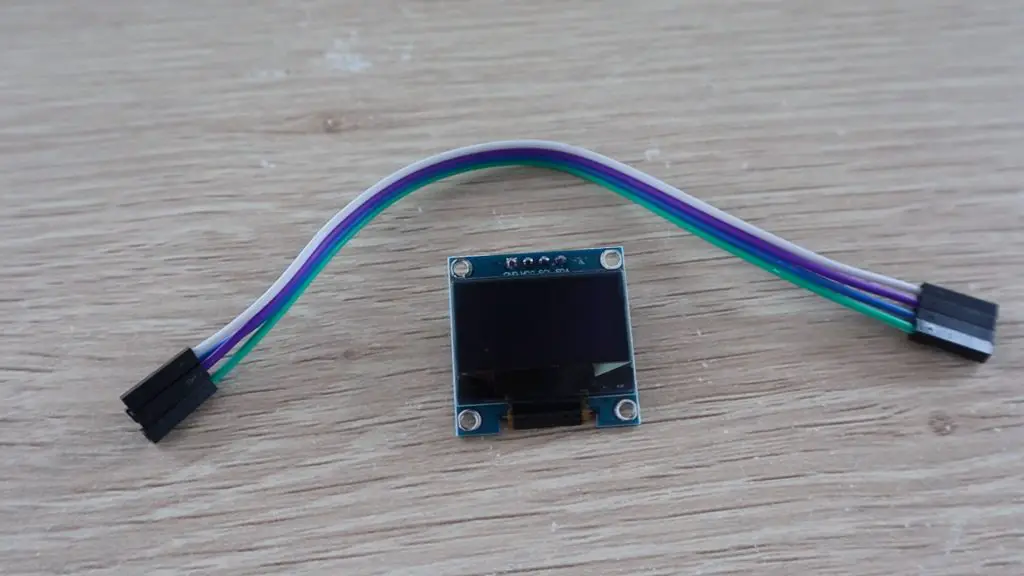
- 128×64 I2C OLED Display – Buy Here
- 15cm Ribbon Cable – Buy Here
- 5V 3A Power Supply – Buy Here
- 4 x M3 Nuts – Buy Here
- 12 x M3x8mm Button Head Screws – Buy Here
Other Equipment Used:
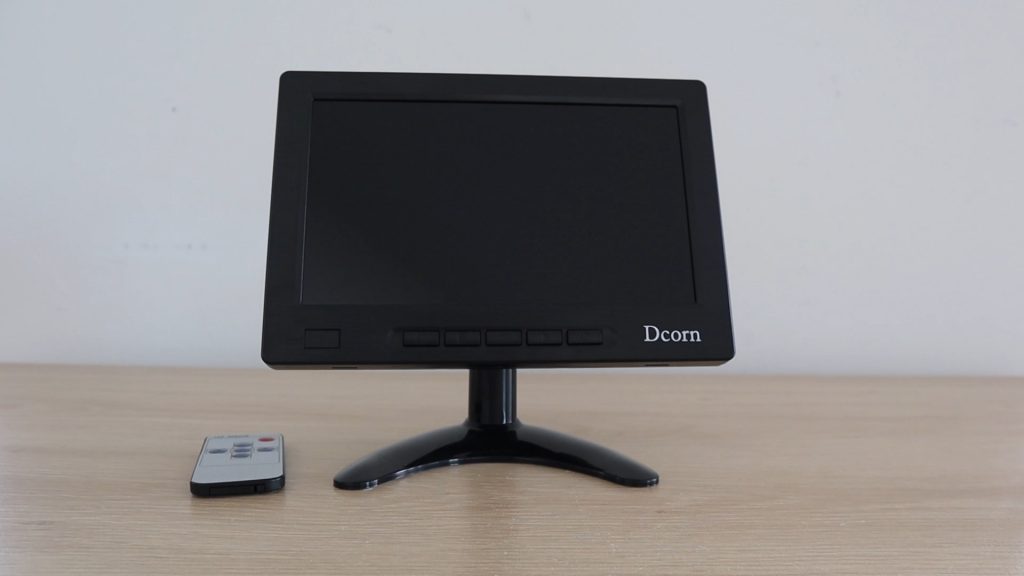
- Portable Monitor – Buy Here
- 3D Printer: Creality Ender 3 V2 – Buy Here
- Laser Cutter: K40 – Buy Here
- Screwdriver – Buy Here
Some of the above parts are affiliate links. By purchasing products through the above links, you’ll be supporting my projects, with no additional cost to you.
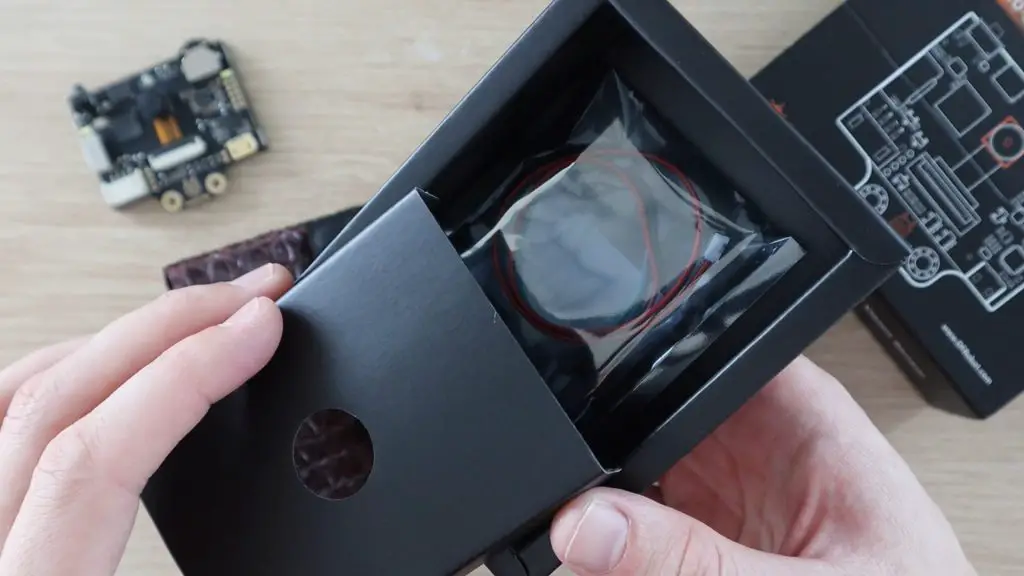
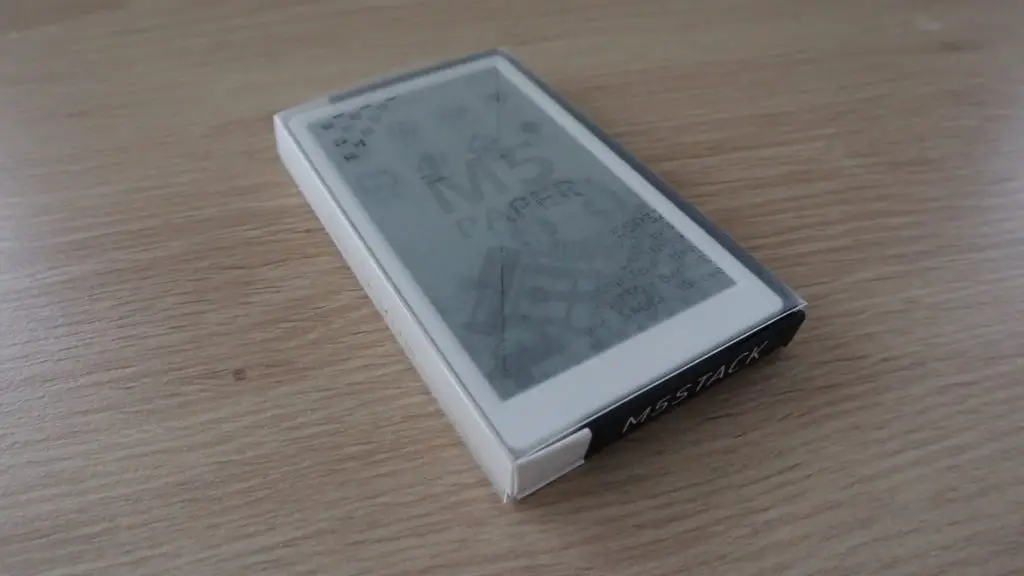
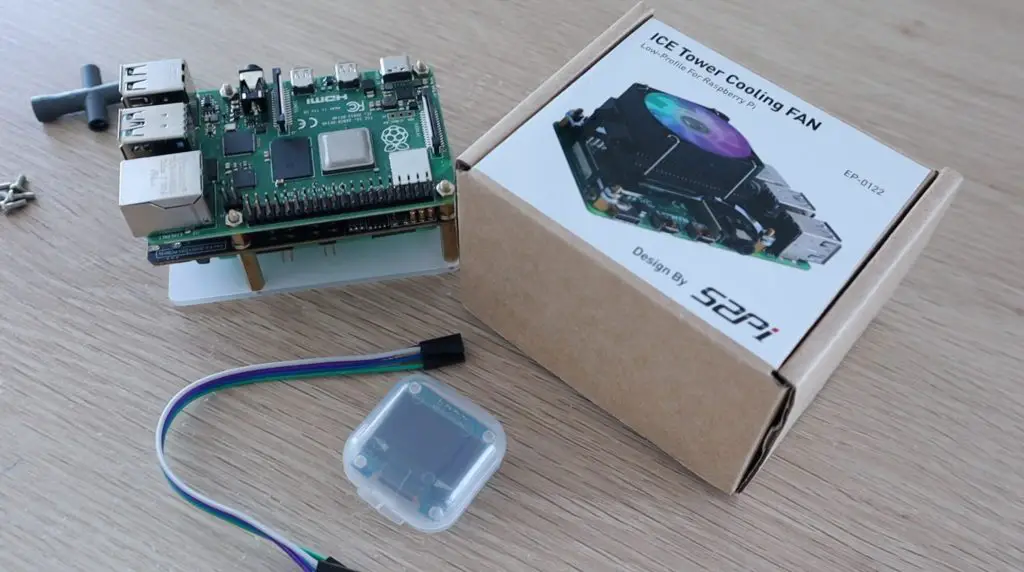
Unboxing The GeeekPi UPS Plus Module
The UPS we’re going to be using is this UPS module that GeeekPi sent to me to share with you.
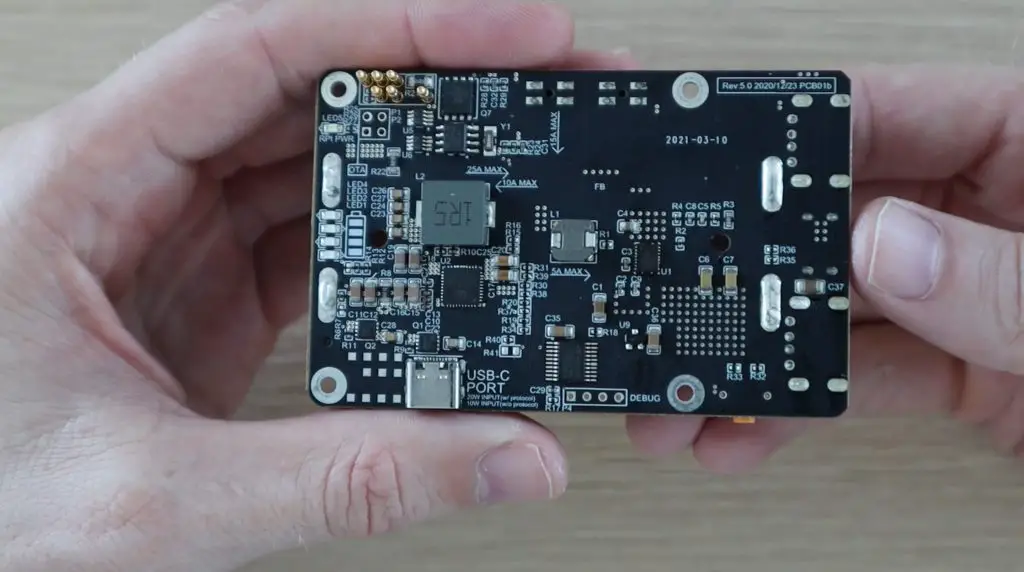
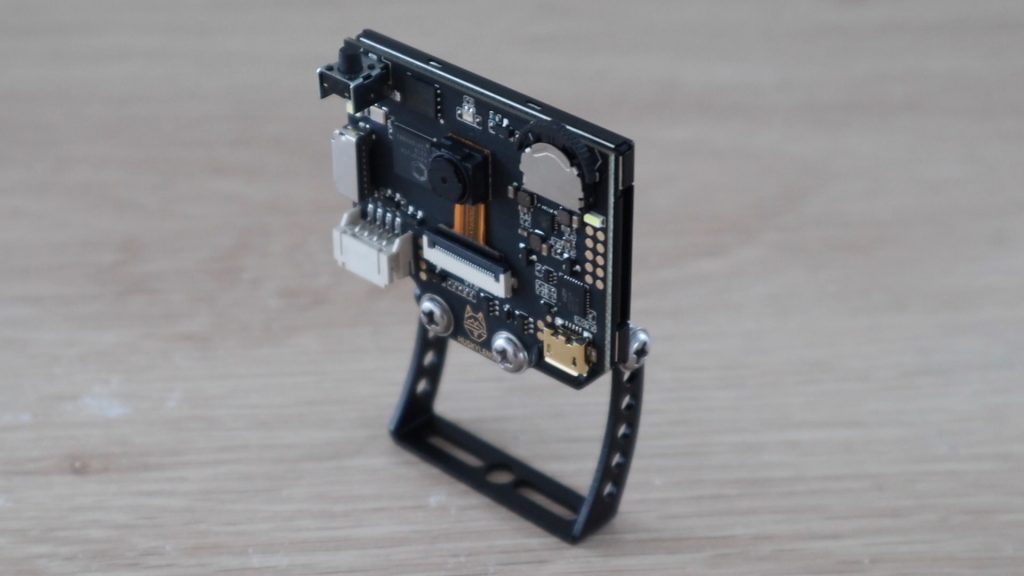
It looks like a relatively simple board, with a prominent battery holder on one side, but it actually has a number of great features, including power management circuits and I2C communication, enabling low voltage safe shutdown and automatic restarts.
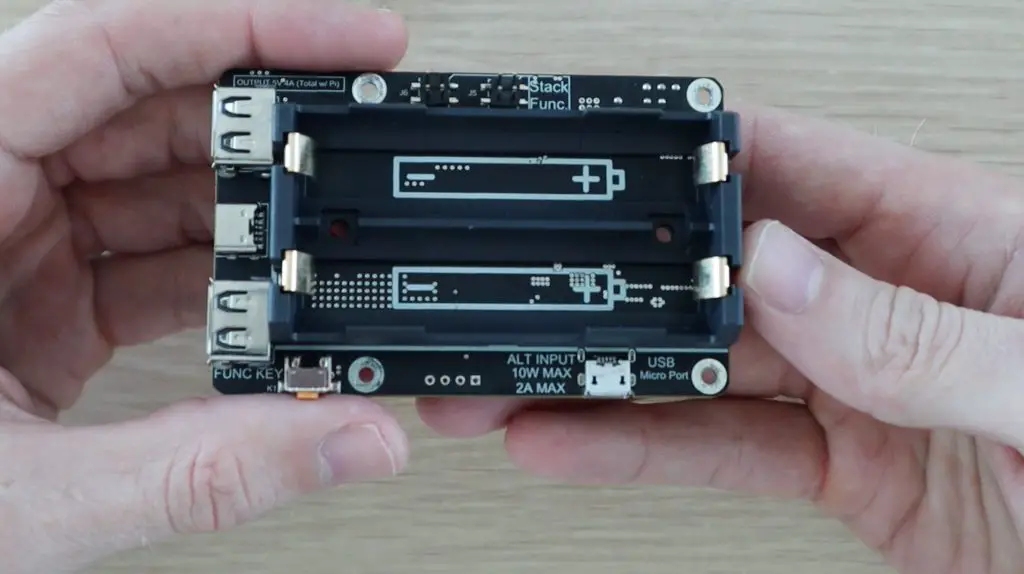
Power is supplied to the UPS through either USB C or a micro-USB port, with the board taking advantage of the USB 3.1 protocol to allow a higher input power through a higher charging voltage.
The board also has three USB ports on the front, two full-size ports and one USB C port, that allow a combined output of up to 4A including the Pi’s consumption. There is also a battery monitor in the form of four blue LEDs that light up and/or flash to indicate the current battery level. And lastly, it has a function button on the side.
This is the most recent 5th revision of this board, which was completed in December of last year.
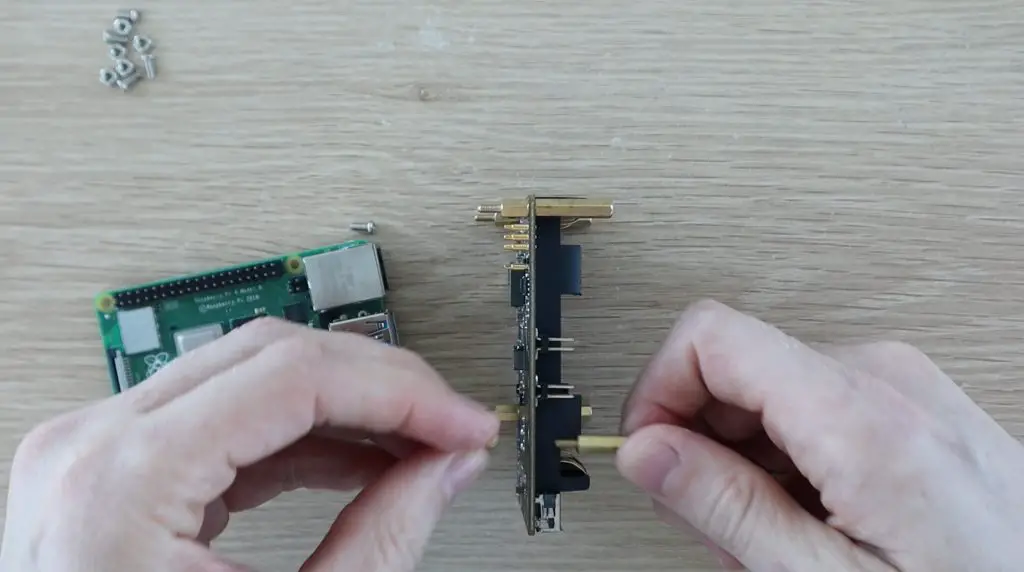
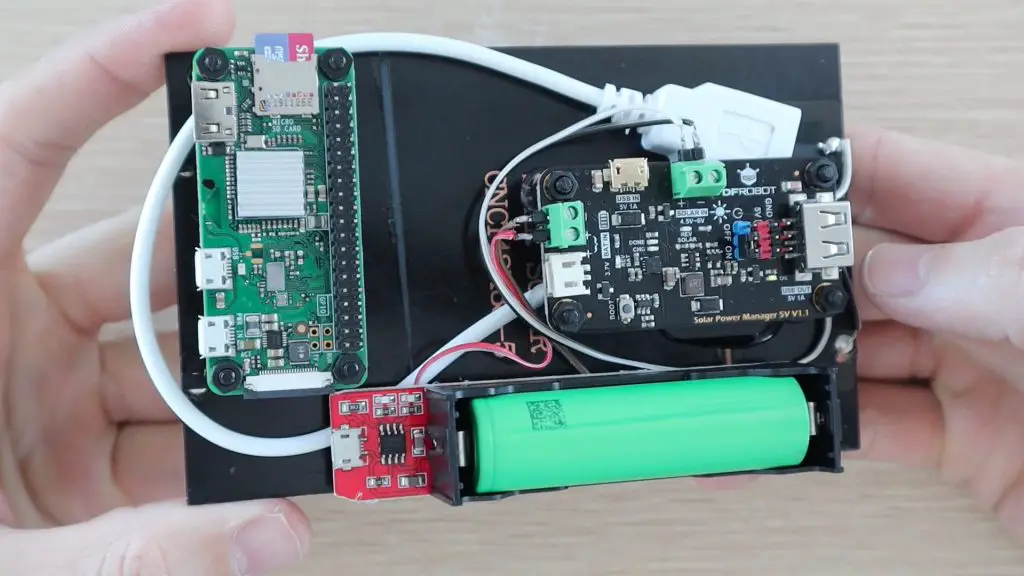
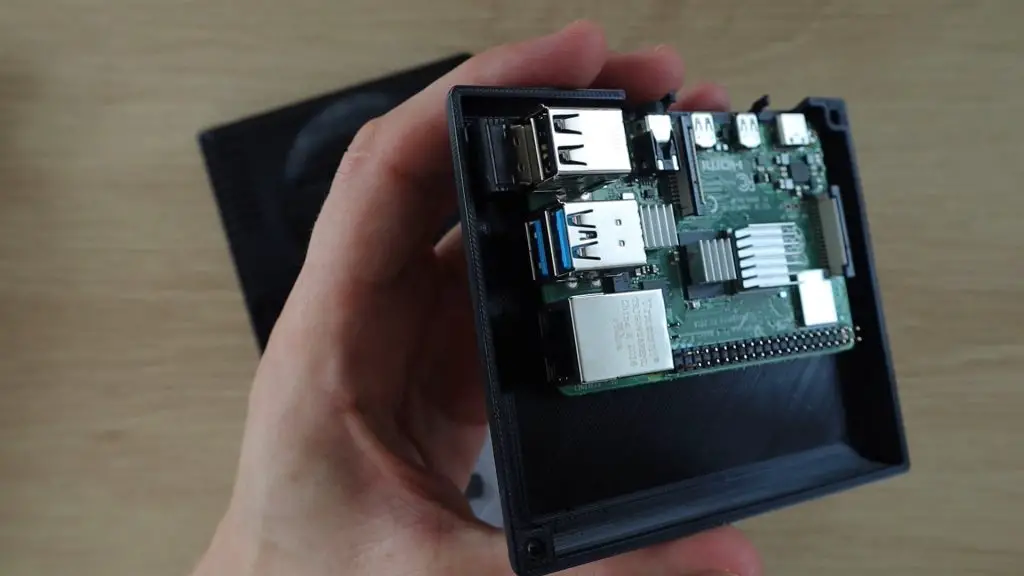
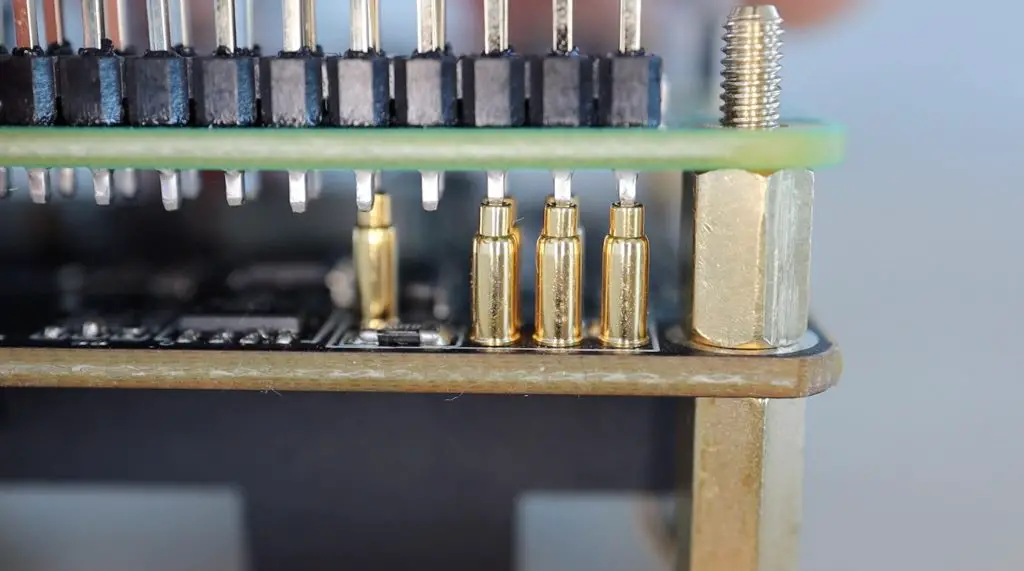
The UPS is mounted onto the PI using some supplied brass standoffs and nuts. Unlike most Raspberry Pi hats, the UPS is designed to mount underneath the PI and has these little spring-loaded gold contacts that make contact with the underside of the header pins. This is a really nice feature as it keeps all of your GPIO pins available for other connections.
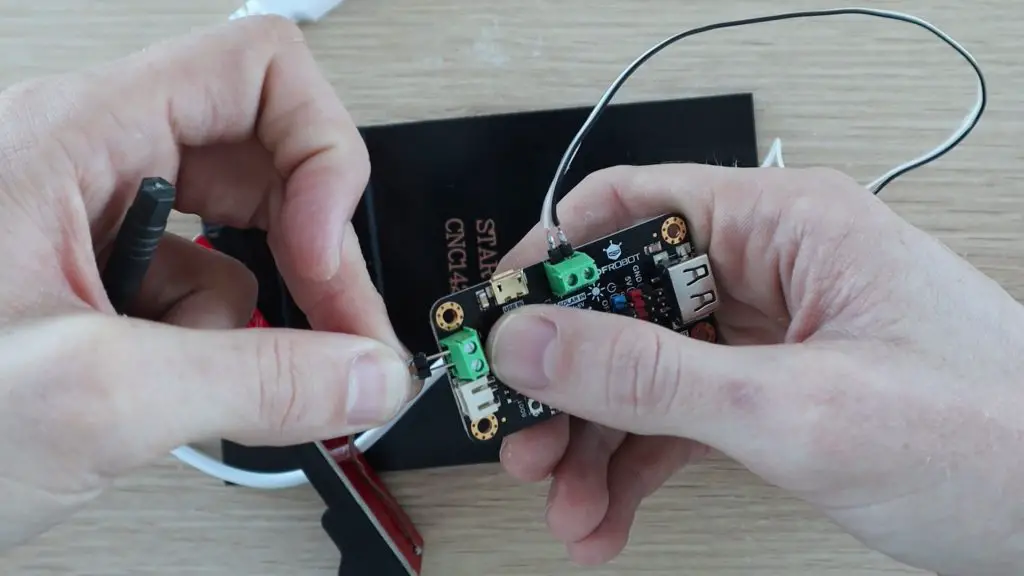
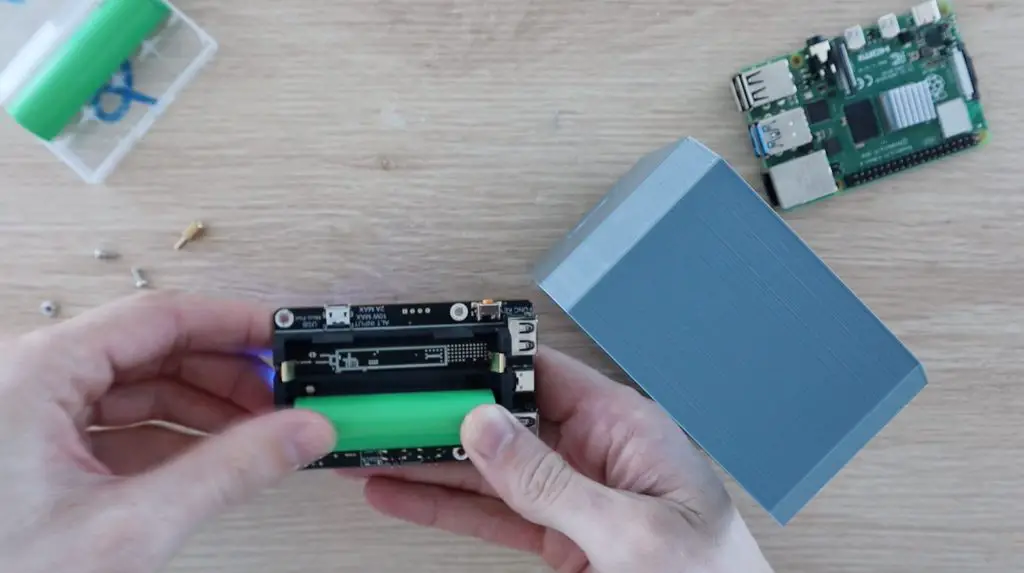
The board takes two 18650 cells that are connected in parallel, so the UPS boosts the voltage of the cells to the 5V required by the Pi. I’m going to be using some 2500mAh cells that I have left over from a previous project.
You may have also noticed in the video that the UPS turned on as soon as the first battery was inserted. You can then turn it on or off using the function button.
The UPS also includes an acrylic base plate to mount it onto. We’re not going to use this as we’re going to be building the Pi and UPS into a custom case.
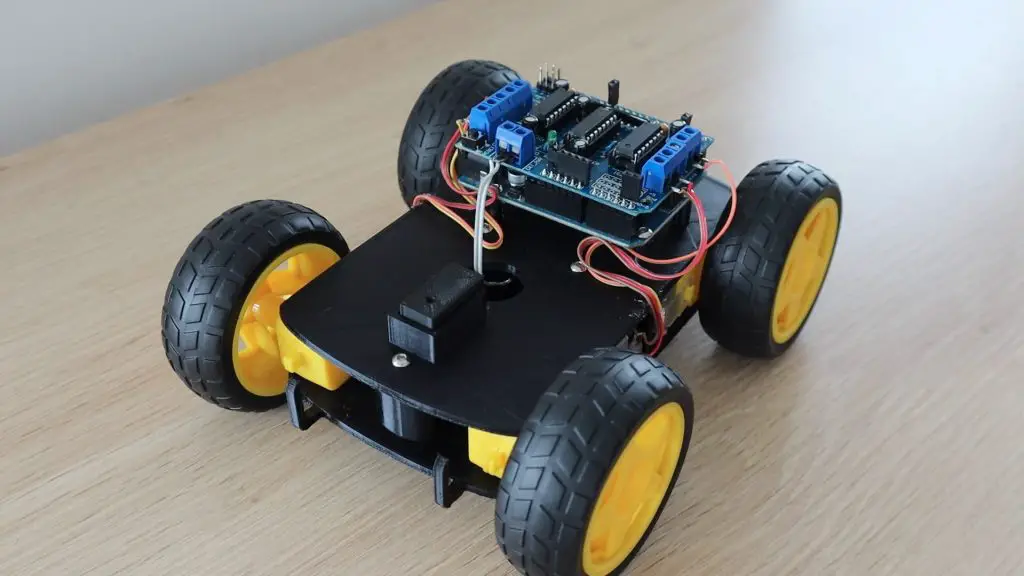
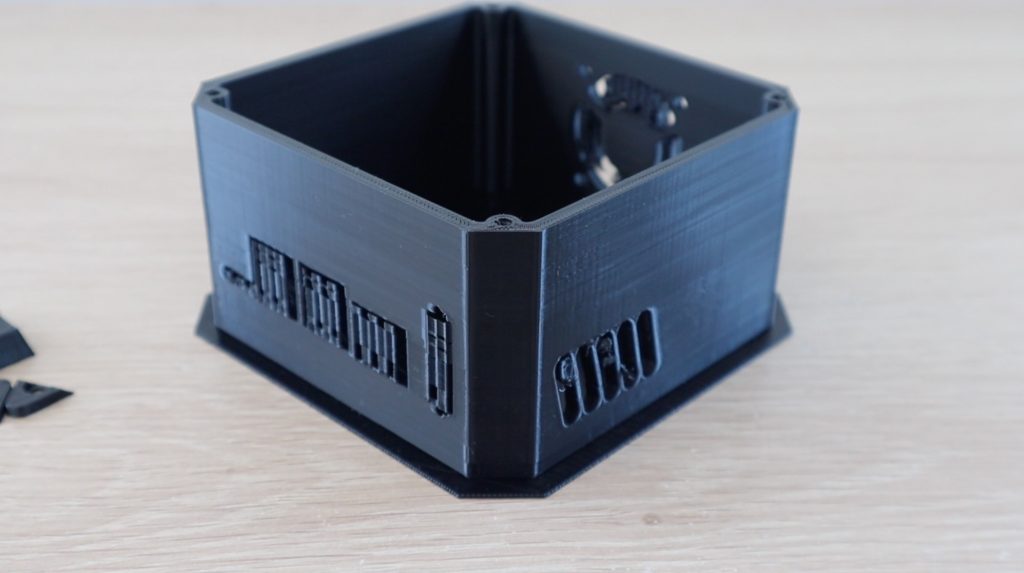
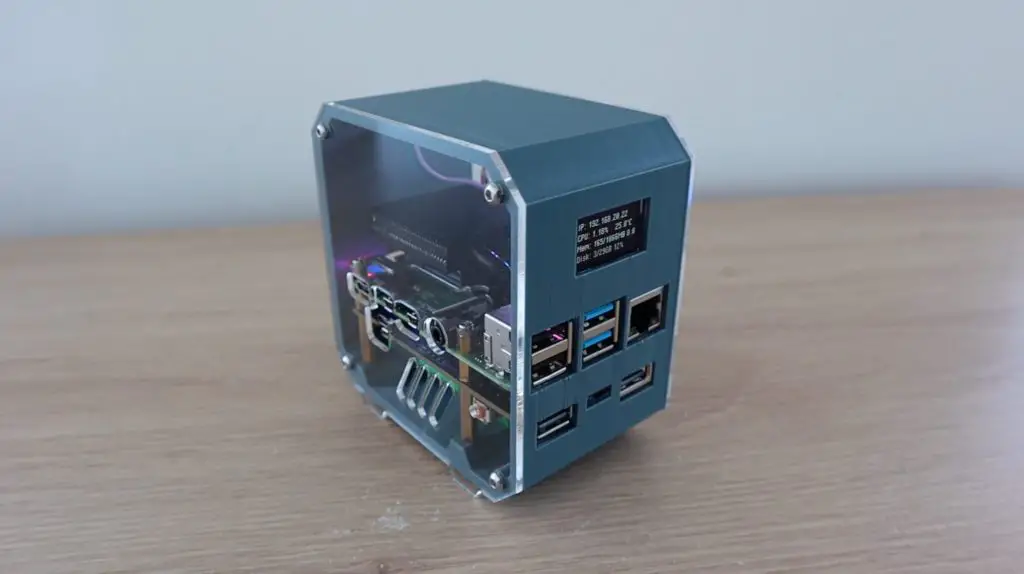
Building The Mini Raspberry Pi Server
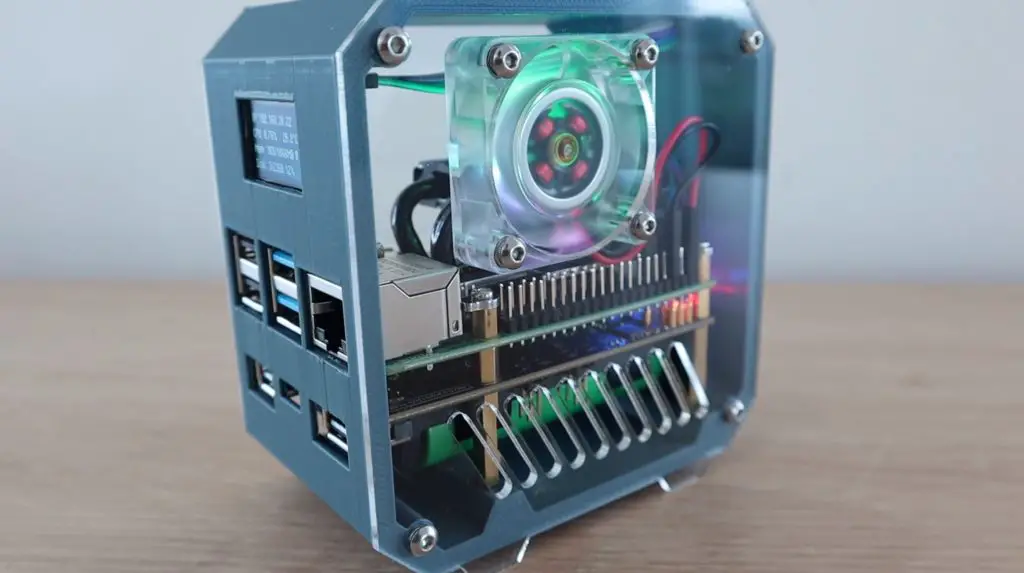
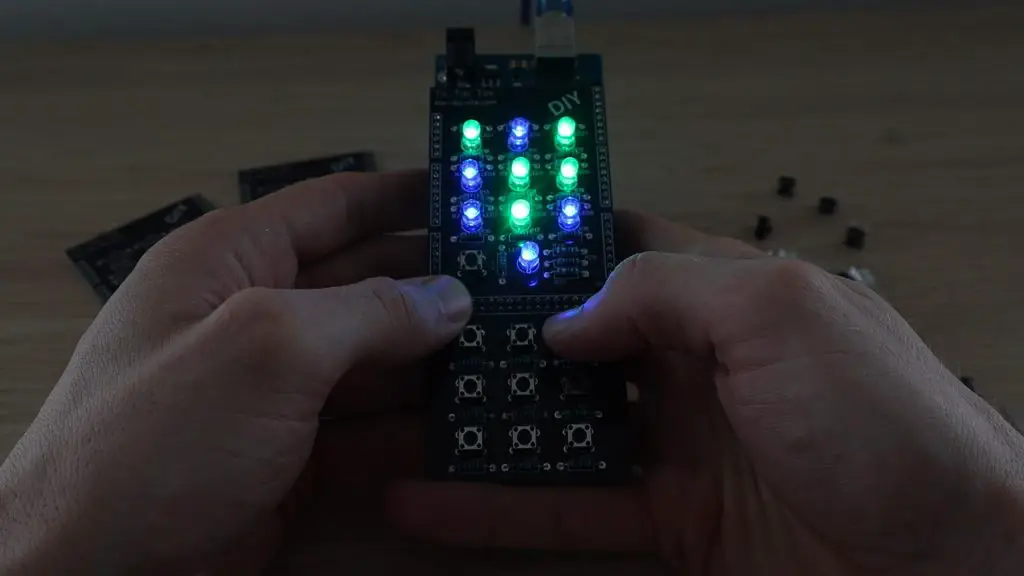
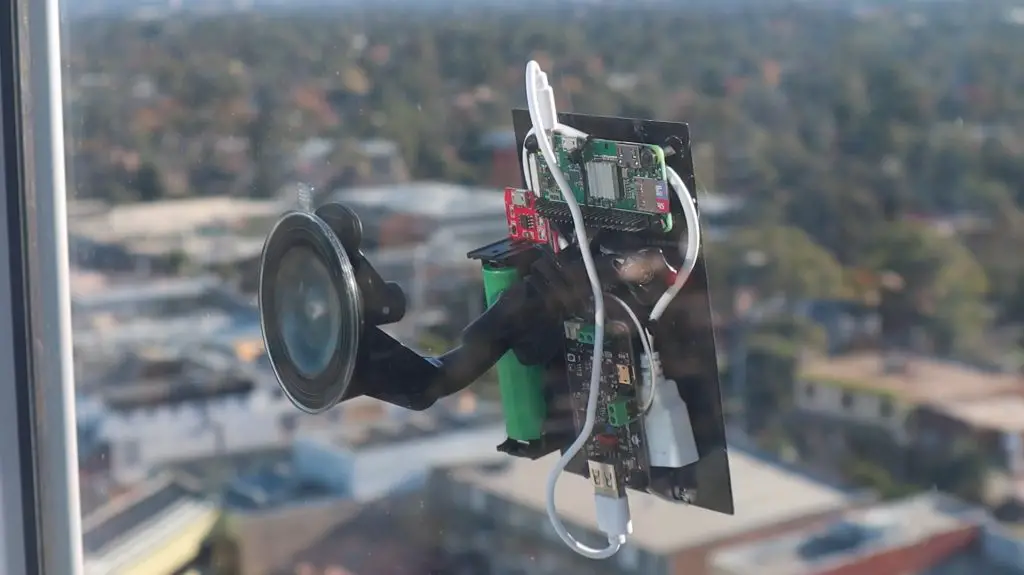
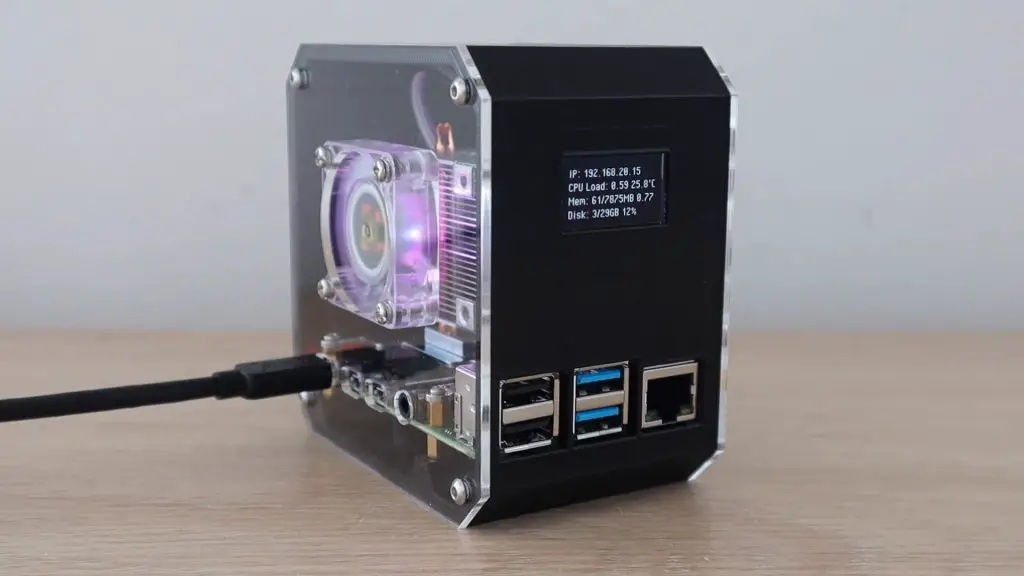
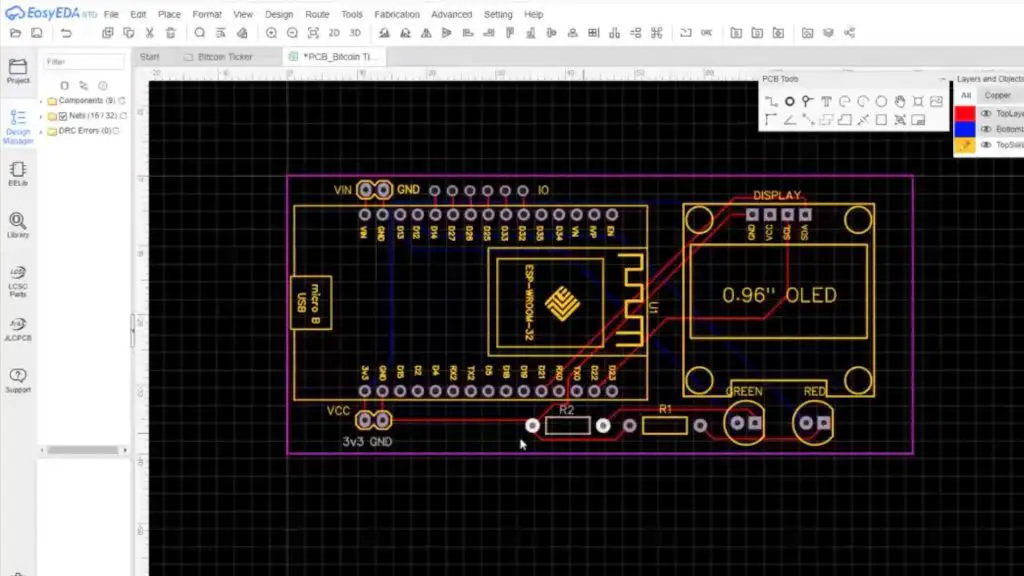
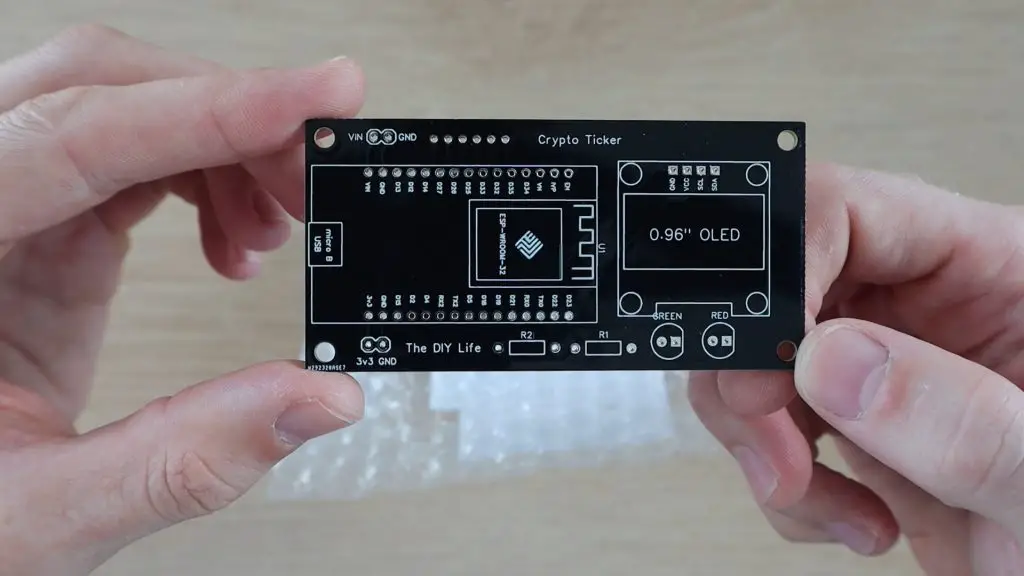
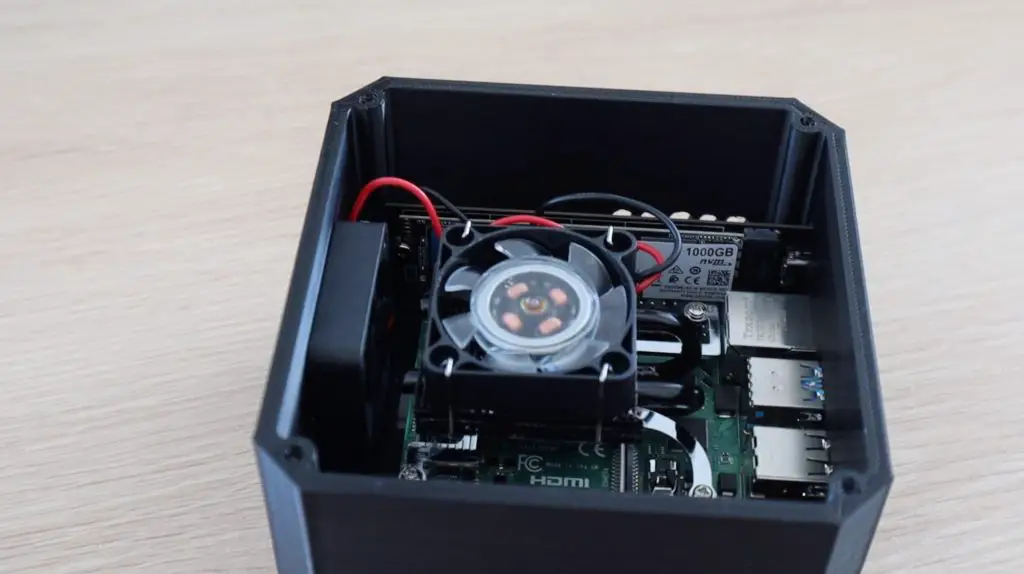
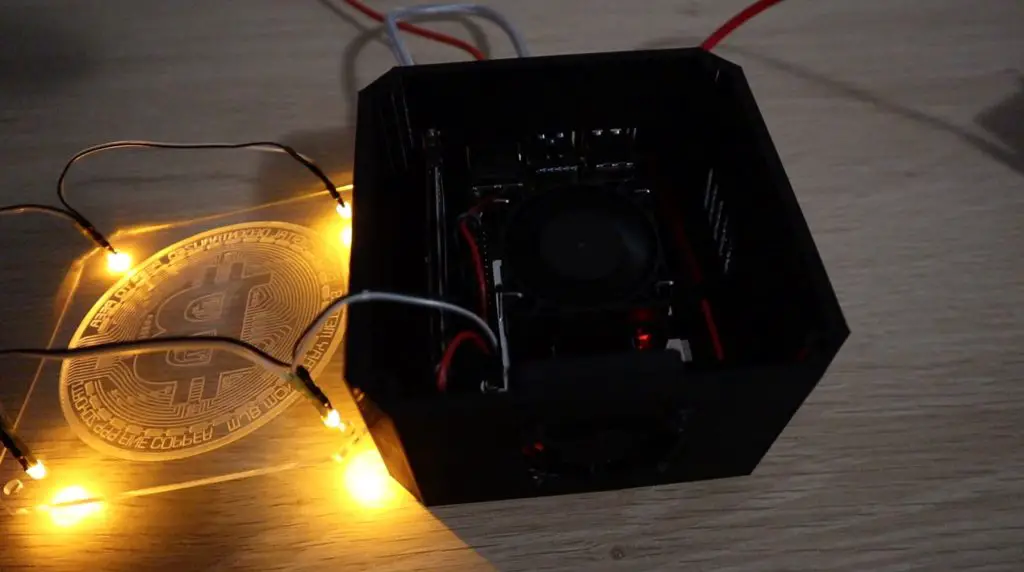
To build the mini server, I’m going to use a low-profile Ice Tower to provide cooling to the Pi and I’m going to add an I2C OLED display to the front of the case to display some performance stats for the Pi as well as stats for the UPS.
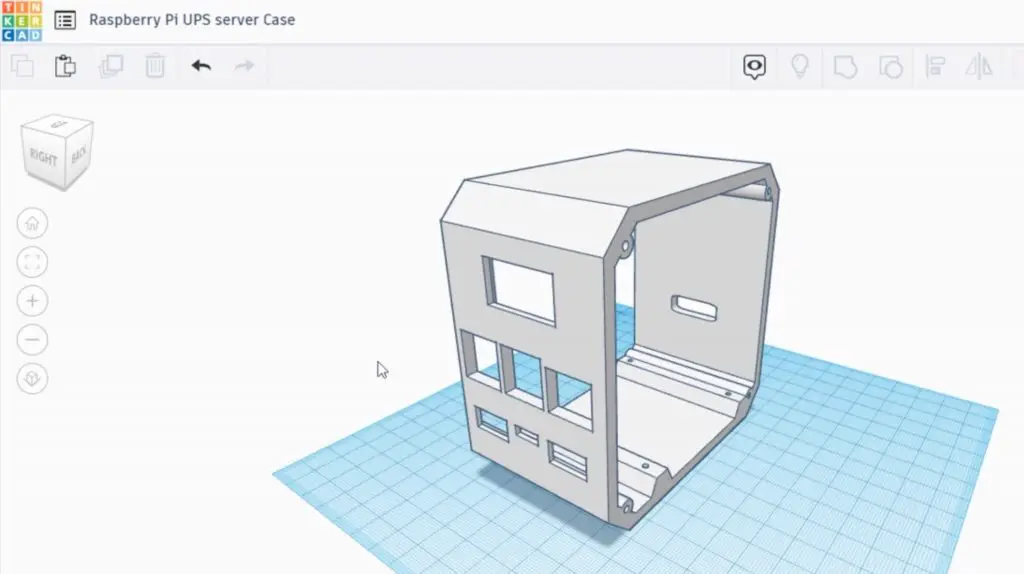
I used my previous Ice Tower Pi case as a starting point and then modified it to accommodate the UPS underneath the Pi. I had to move the OLED display up a bit to clear the top of the Pi’s USB ports.
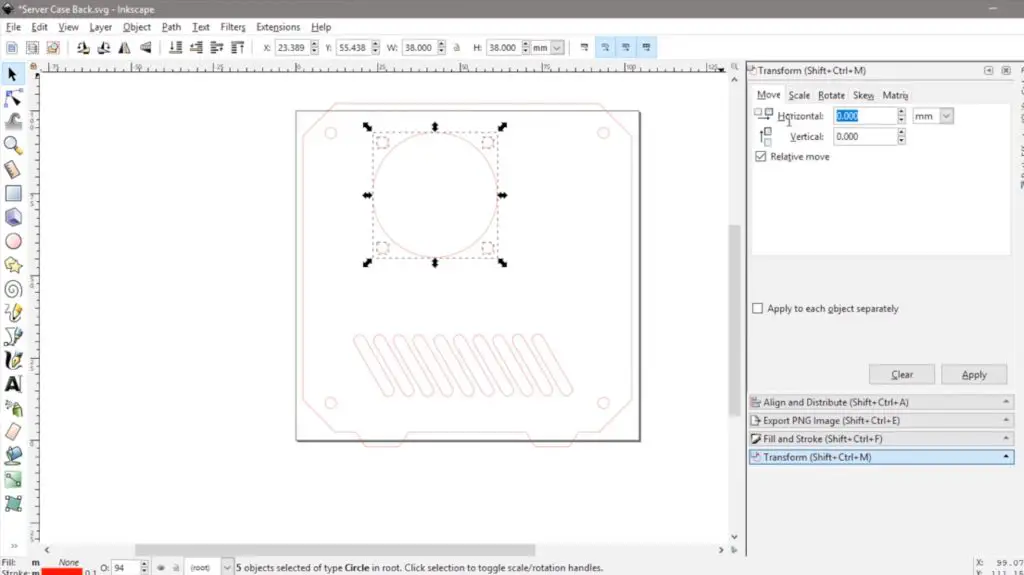
Designing The Server Case To House The UPS
Download the 3D print and laser cutting files or buy a complete case kit.
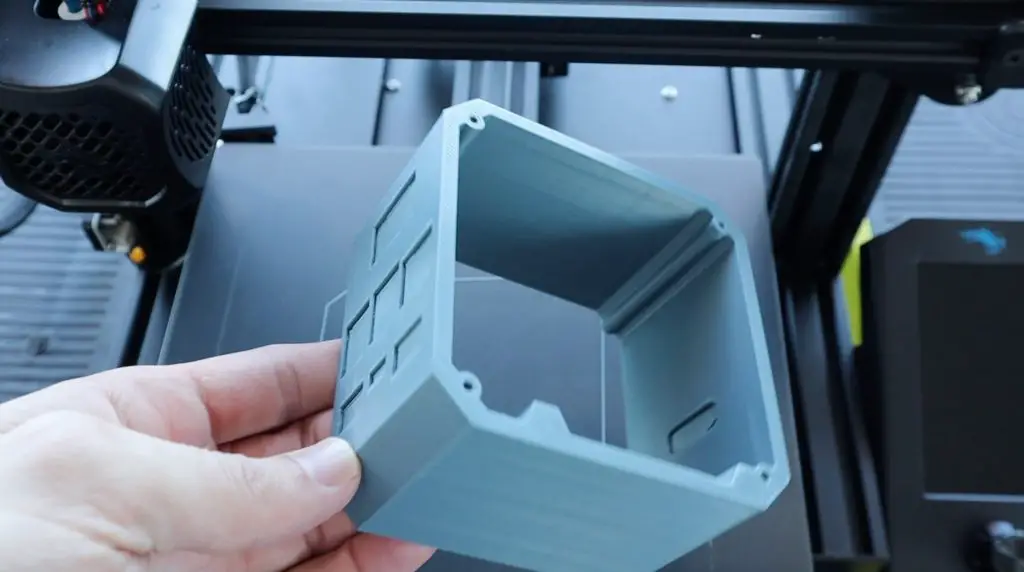
I then 3D printed the case on my Creality Ender 3 V2 in grey PLA with a 15% infill.
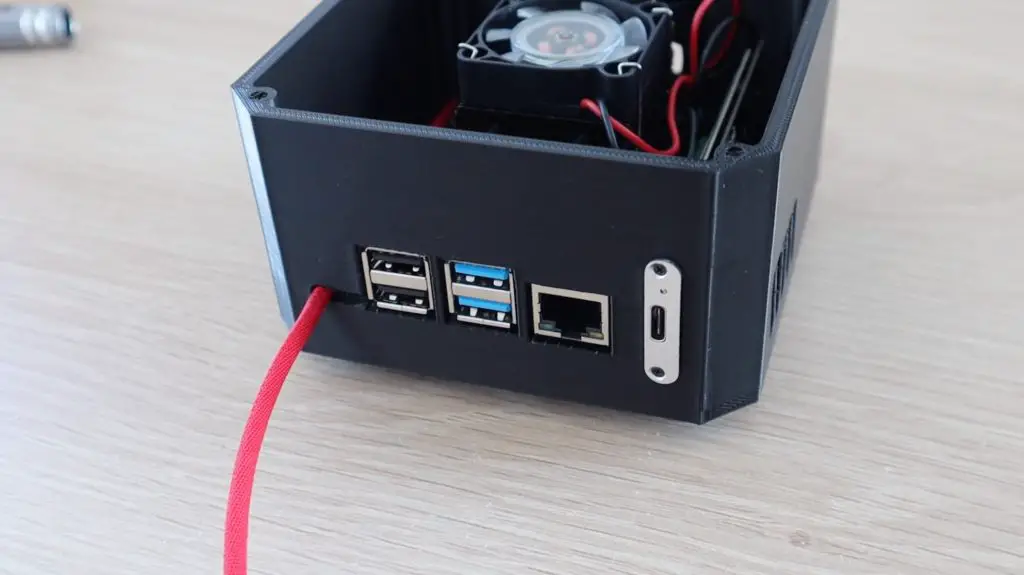
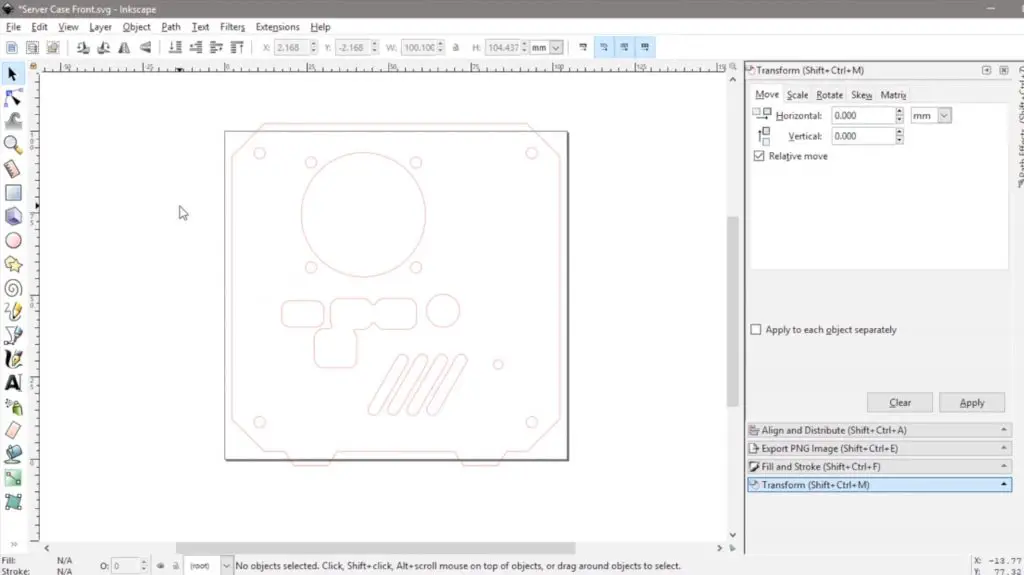
I then also had to make some modifications to the clear acrylic side panels. I moved the Pi ports higher up and added the additional cutouts for the UPS underneath them. I also added a couple of vent holes along the bottom so that air would be forced around the Pi to cool the UPS and batteries.
With the case and side panels made up we can start installing the components into the case.
Assembling The Server With UPS
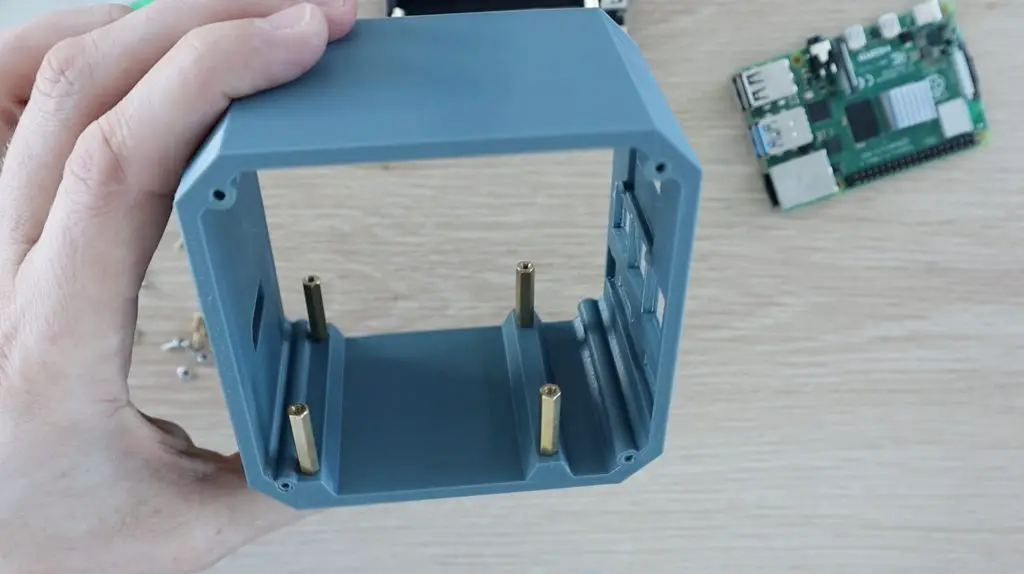
I started by screwing the longer brass standoffs into the base of the case. These are quite tight initially, but need to be so that they don’t move when plugging or unplugging peripherals into the Pi’s ports.
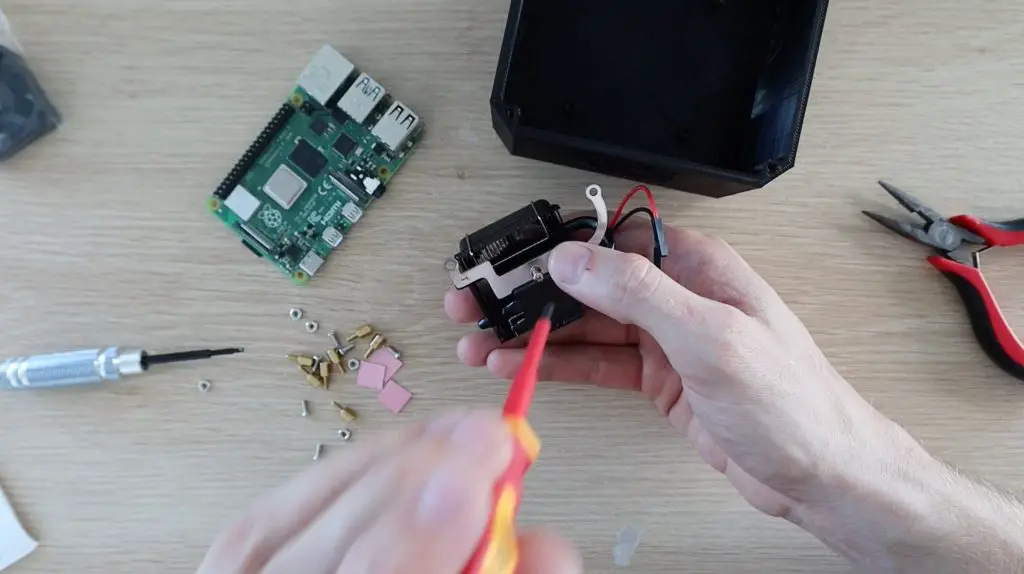
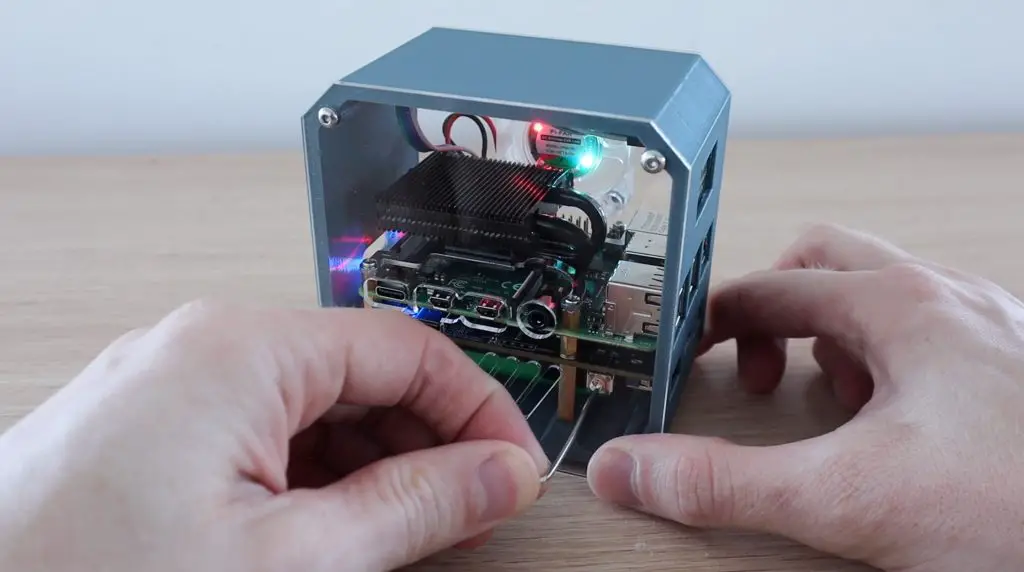
I then put the batteries into the holder and mounted the UPS. You need to be careful from this point as there isn’t any way to physically isolate the batteries, so some parts of the UPS are powered and you risk shorting and potentially damaging the board if it touches the metal standoffs in any area it’s not supposed to.
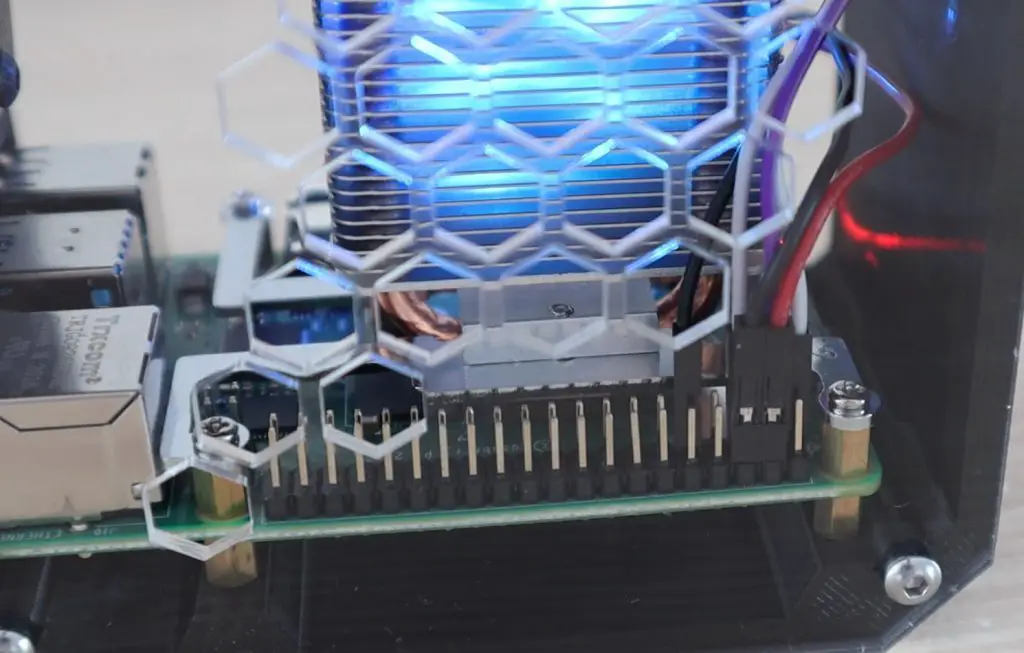
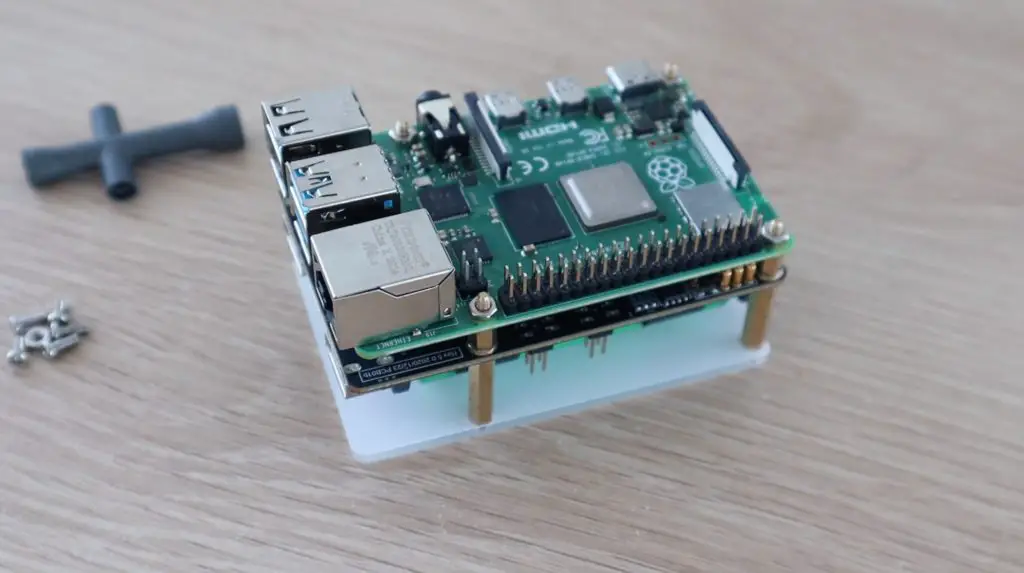
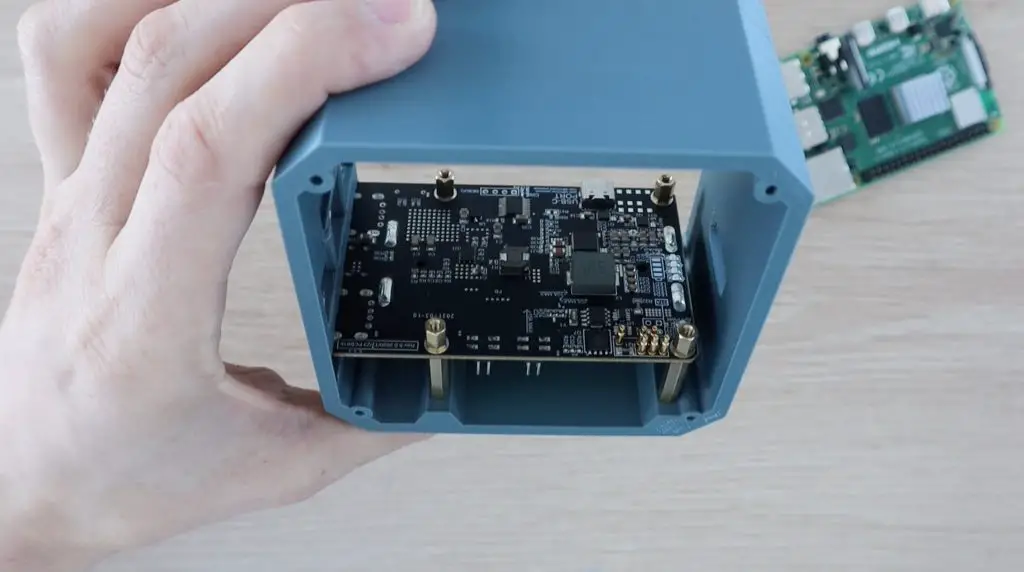
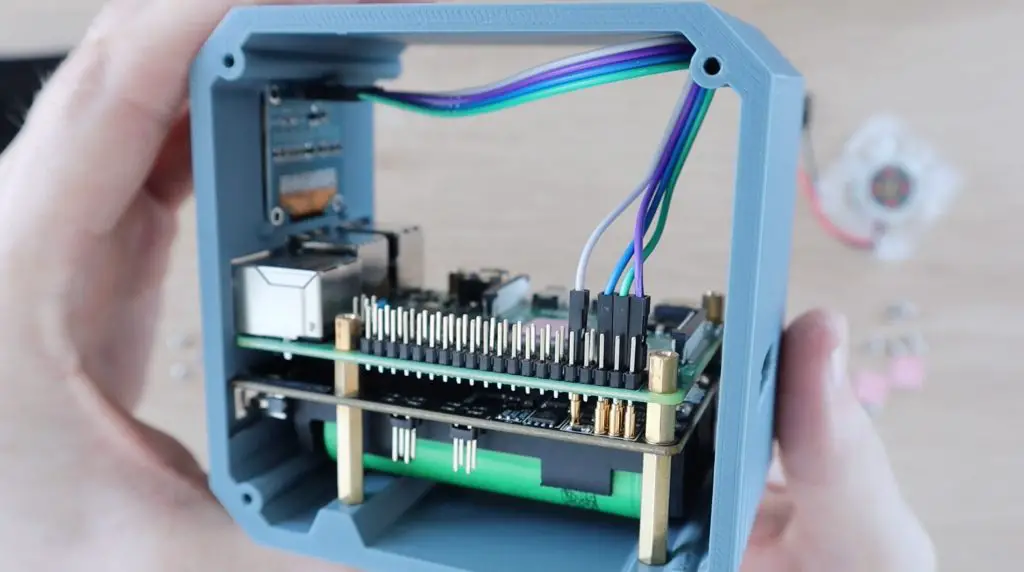
The smaller brass standoffs then hold the UPS in place and we can then mount the PI onto them, making sure that the terminals are properly seated on the GPIO pins.
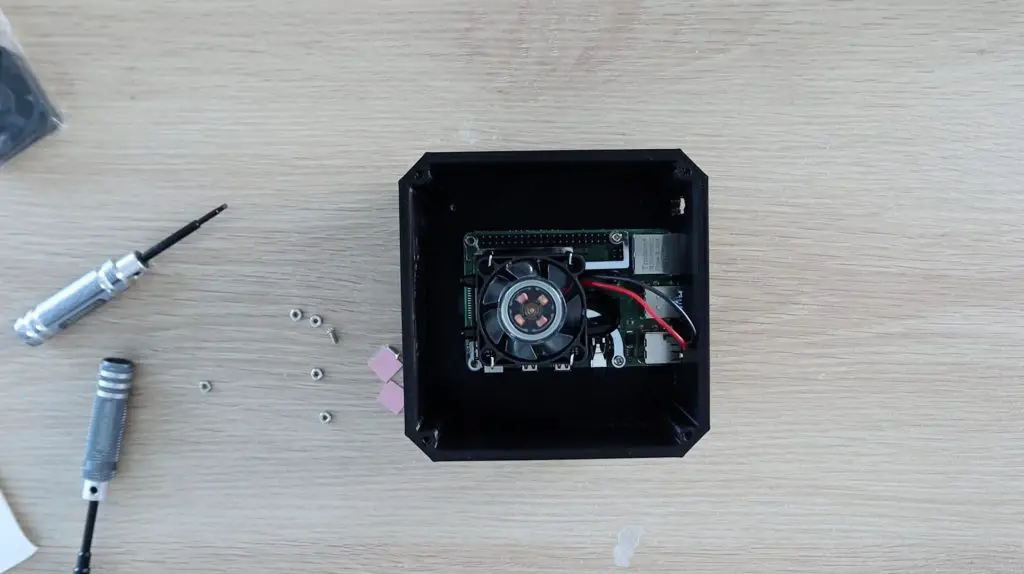
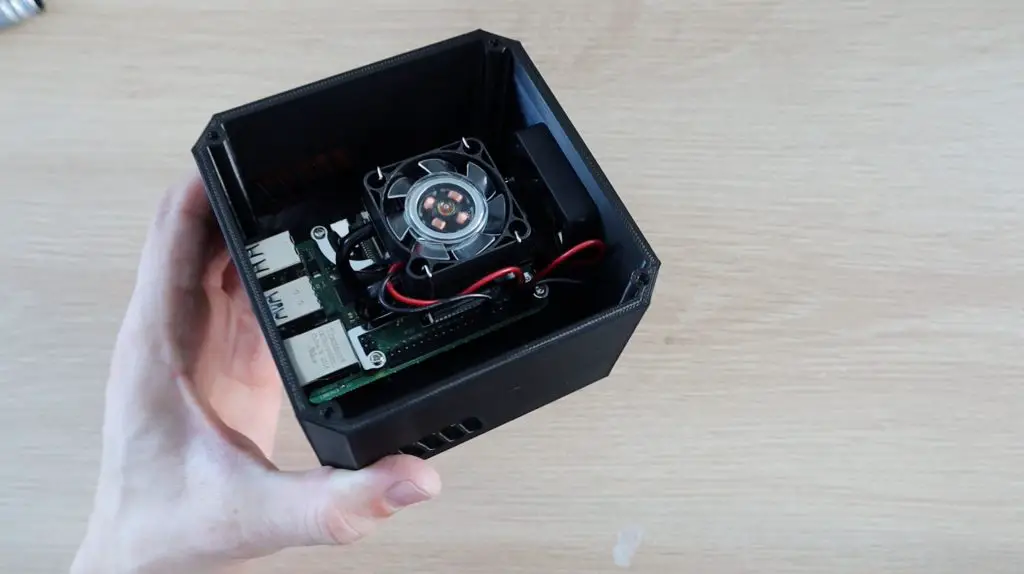
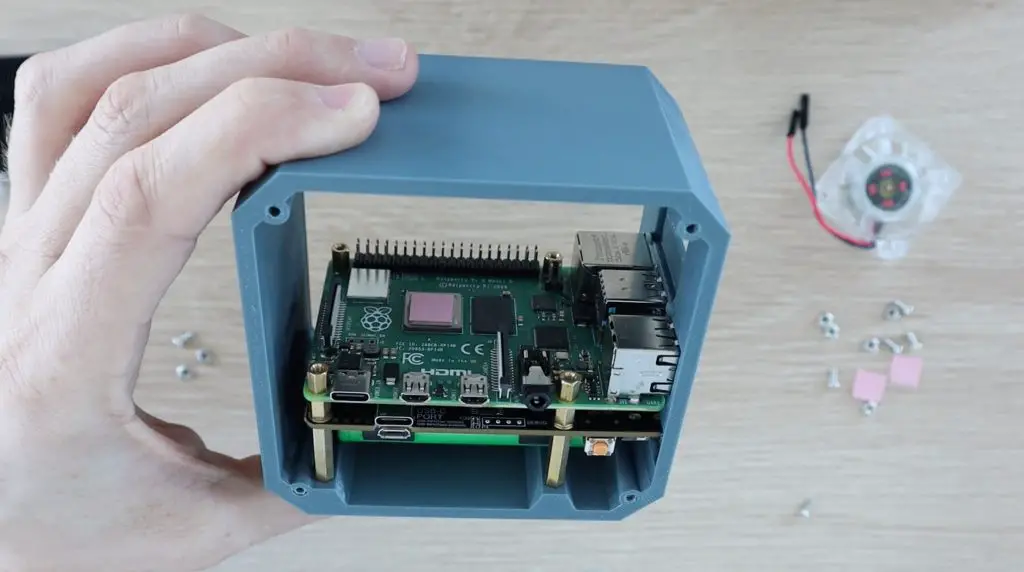
The Pi is then held in place with the standoffs from the Ice Tower.
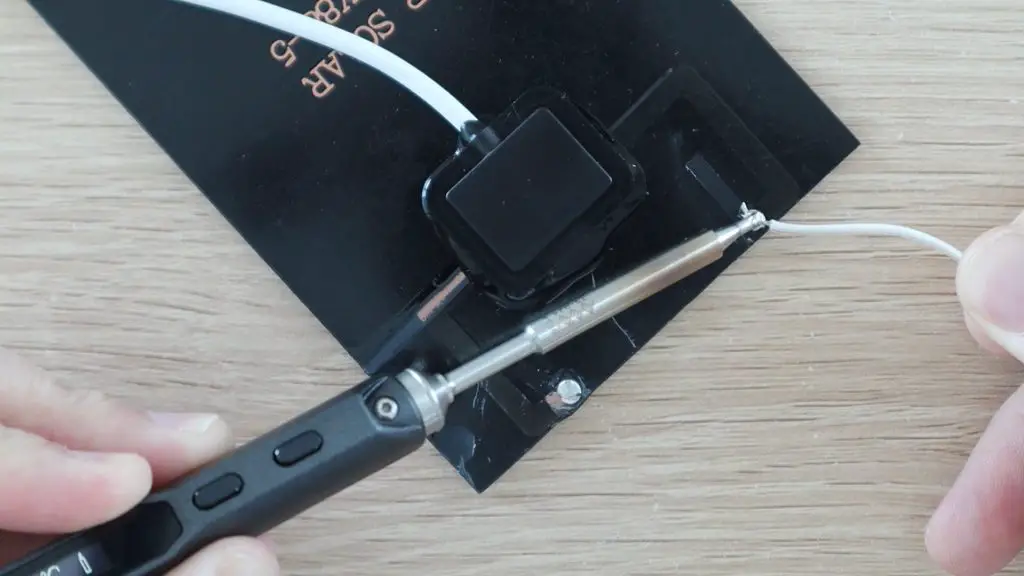
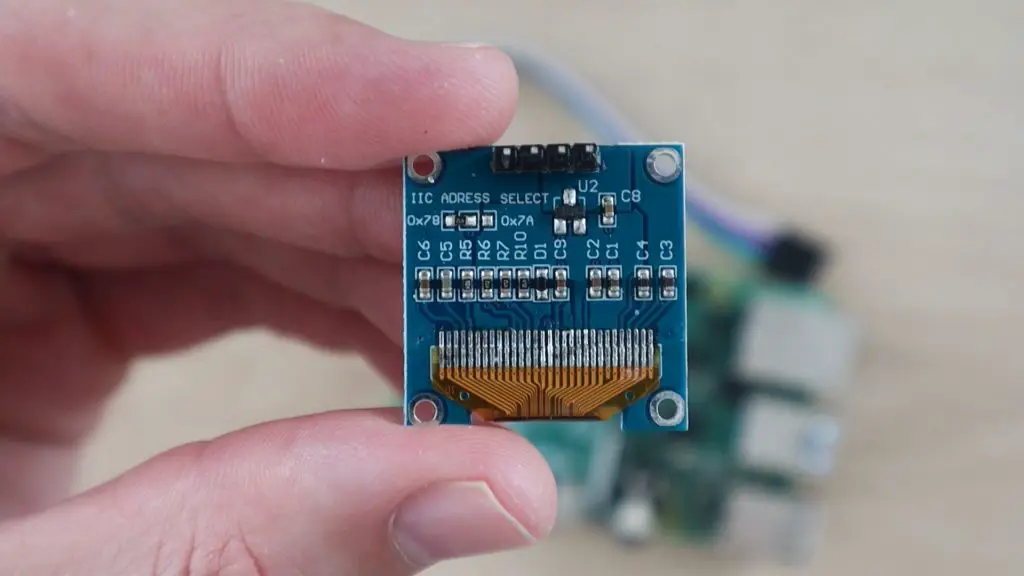
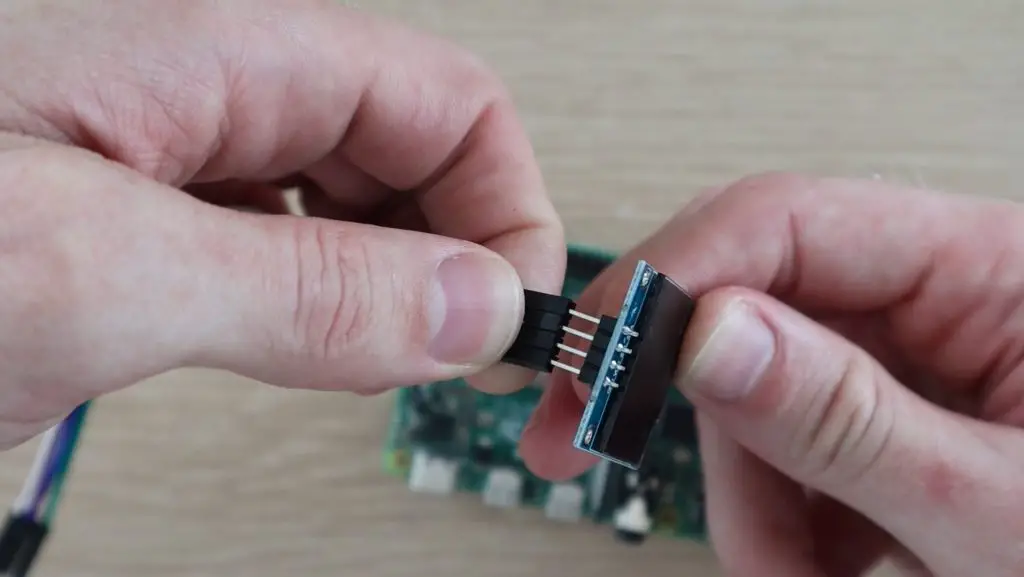
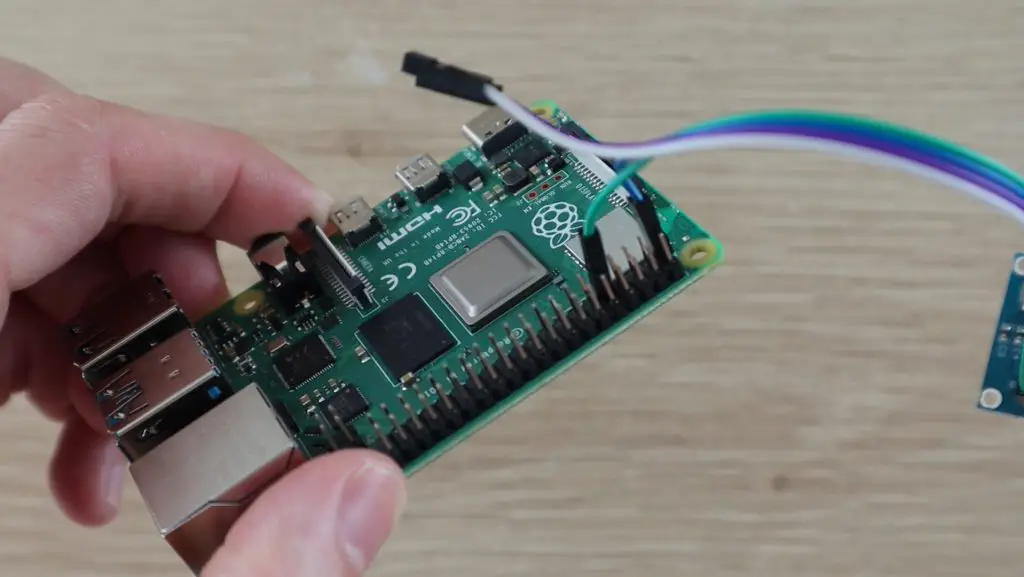
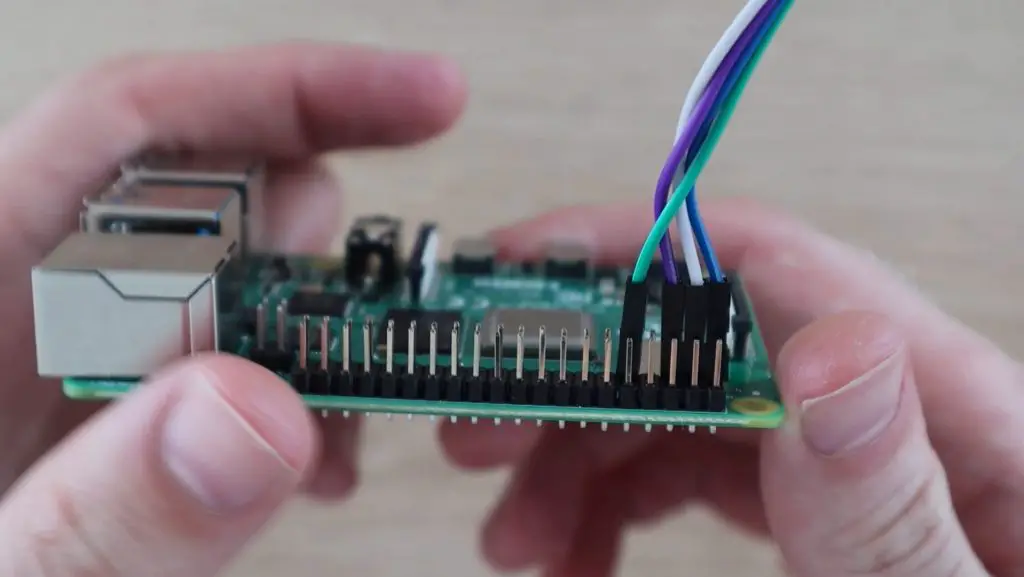
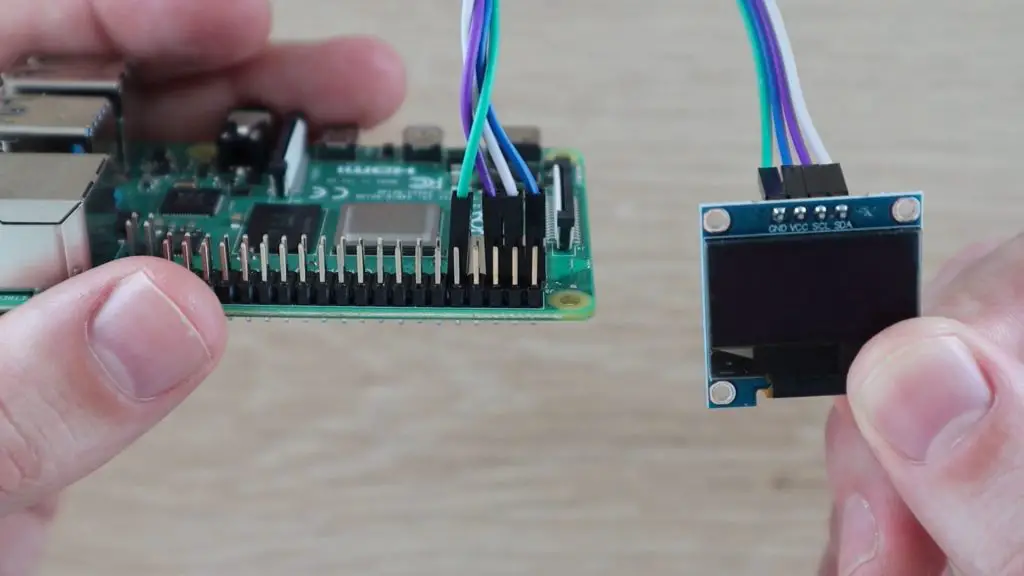
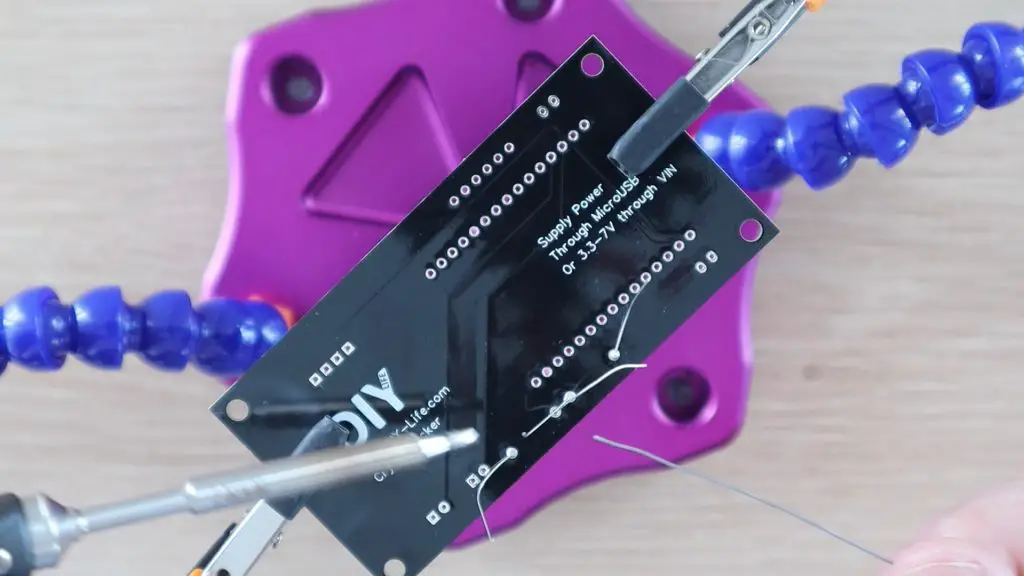
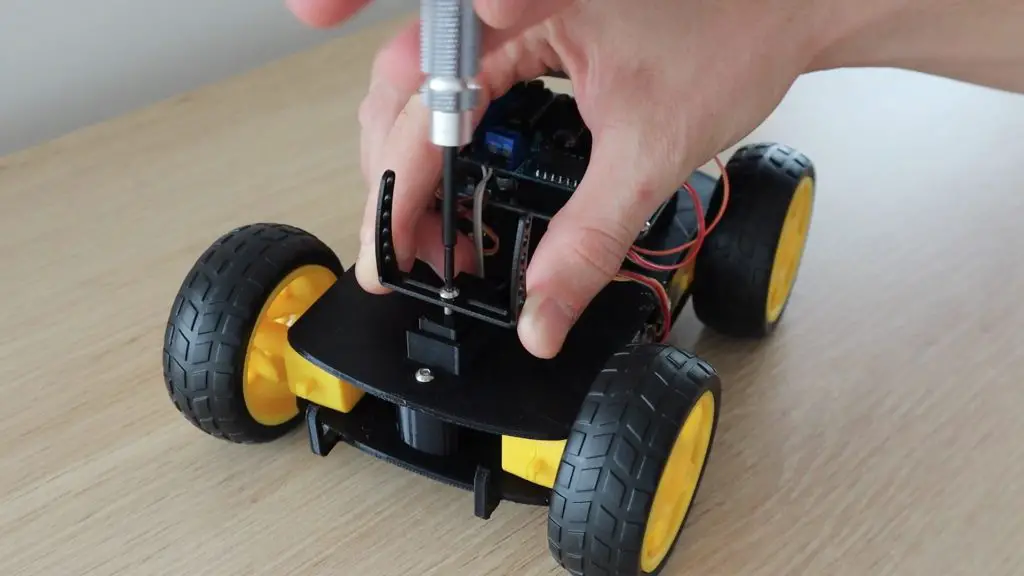
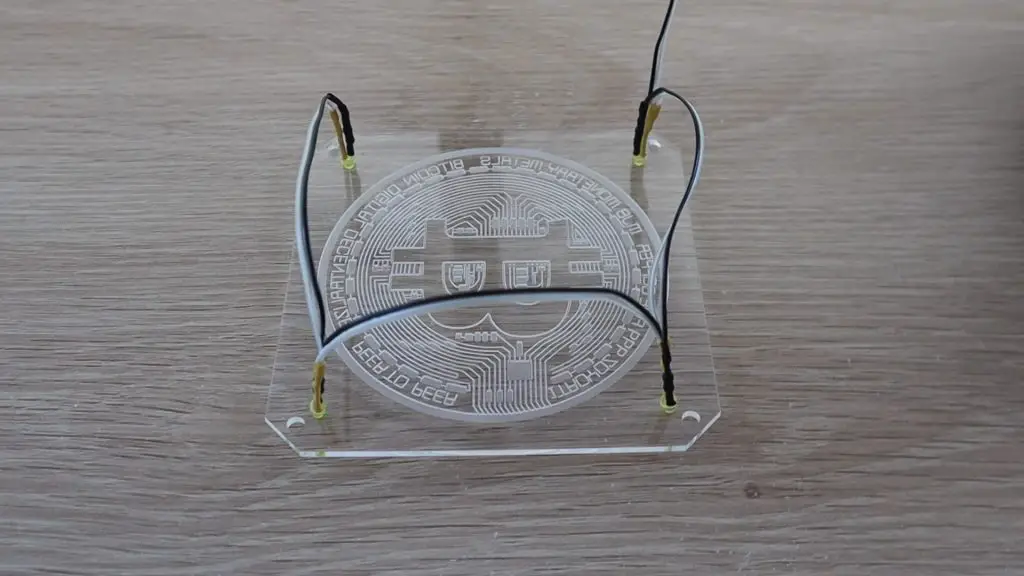
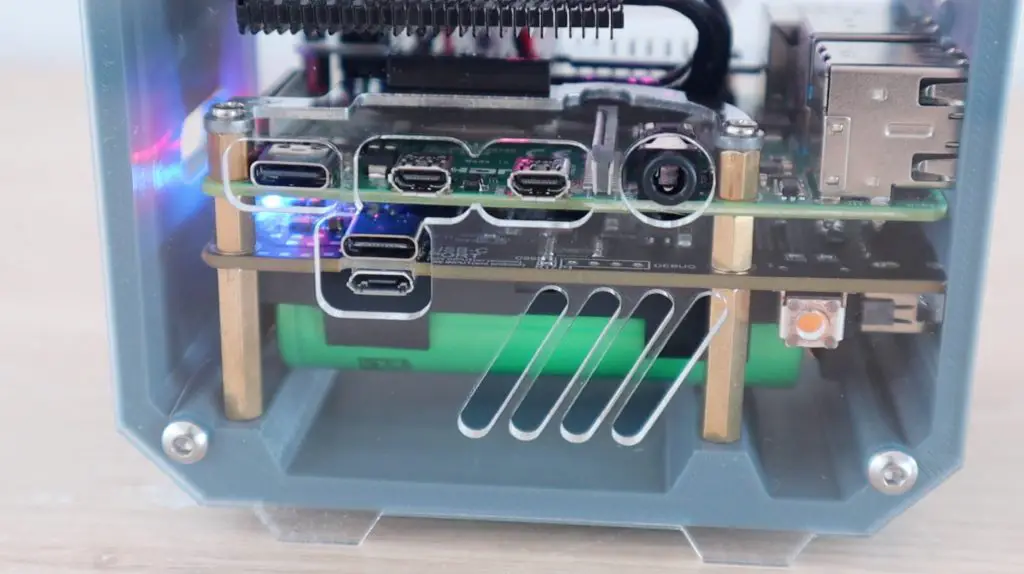
Before installing the Ice Tower, I’m going to install the OLED display.
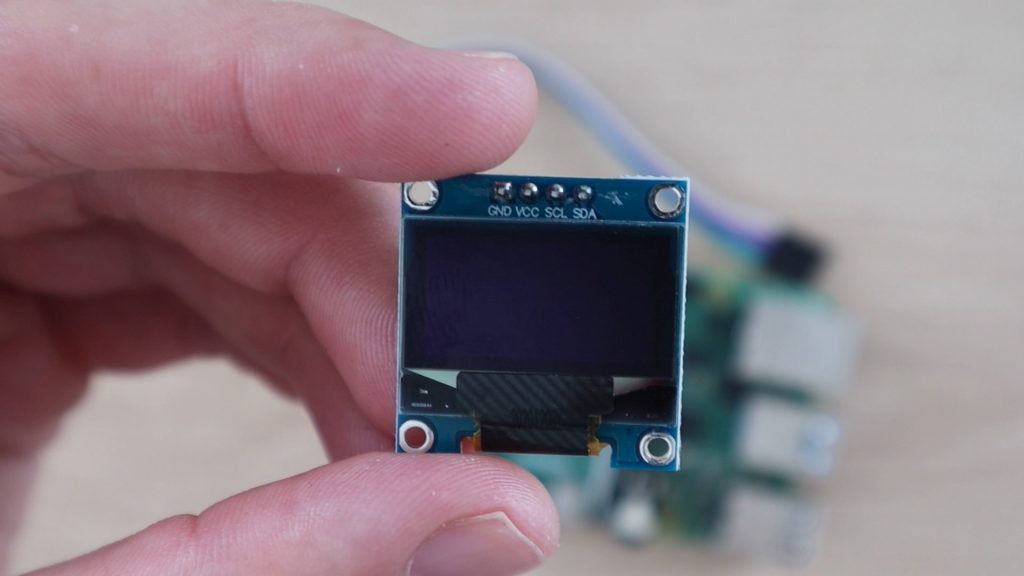
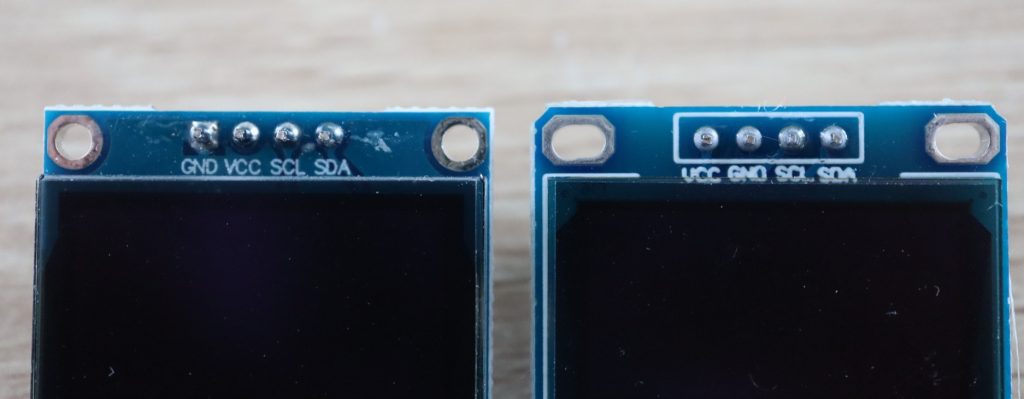
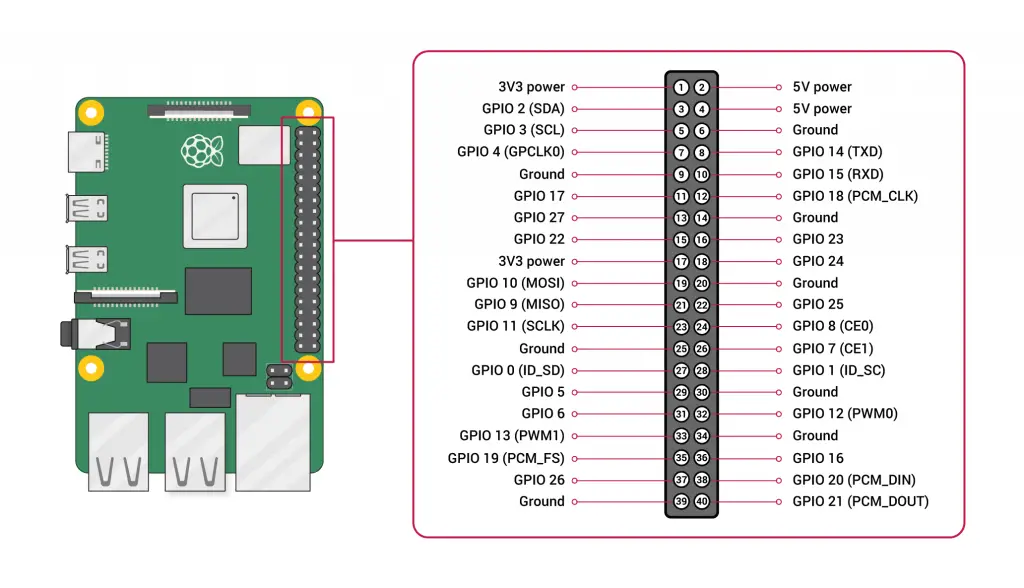
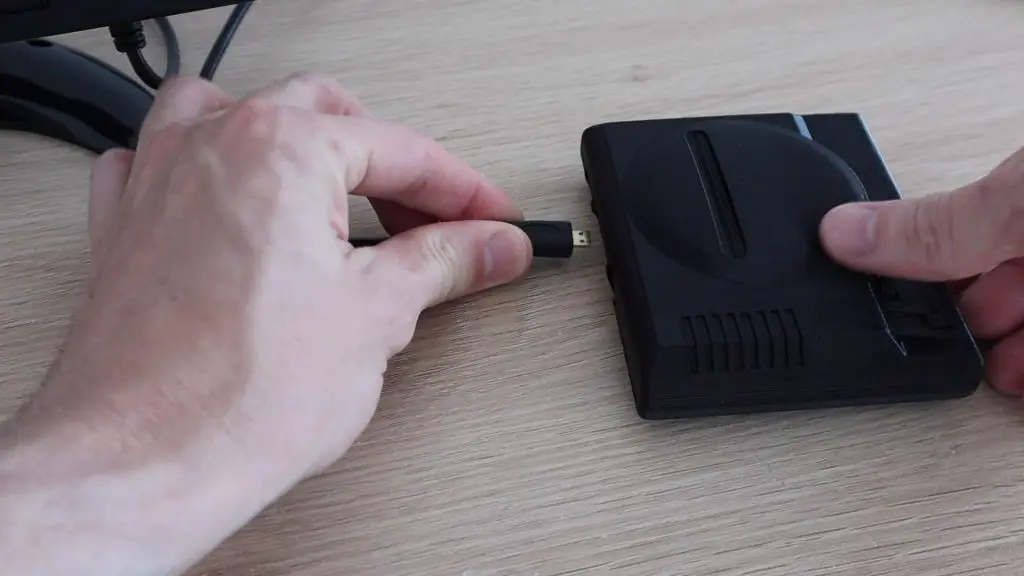
This just pushes into the holder in the case and I’ll connect a ribbon cable to the pins on the back to plug it into the Raspberry Pi. These provide power to the display and connect to the Pi’s I2C pins.
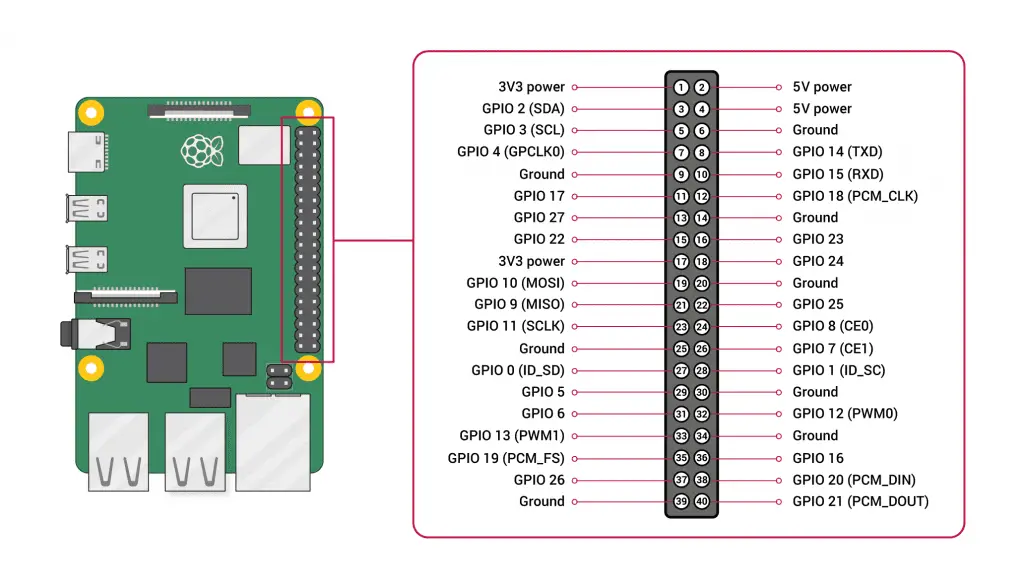
The connections are typically:
- GND to Pin14 Ground
- VCC to Pin1 3.3V Power
- SCL to Pin5 SCL (GPIO3)
- SDA to Pin3 SDA (GPIO2)
Have a look at my detailed guide on Connecting an OLED Stats Display to your Pi for more information on this.
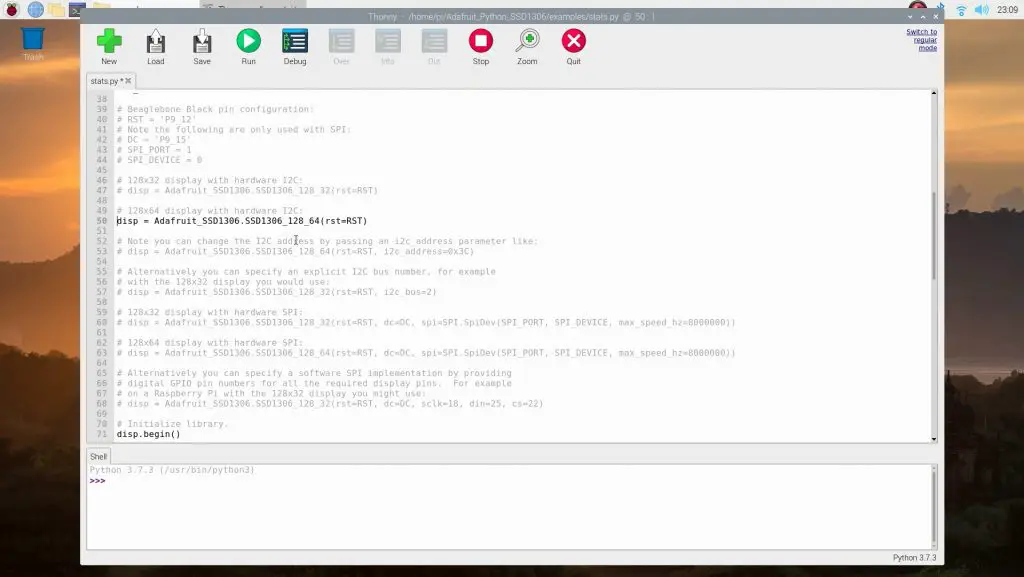
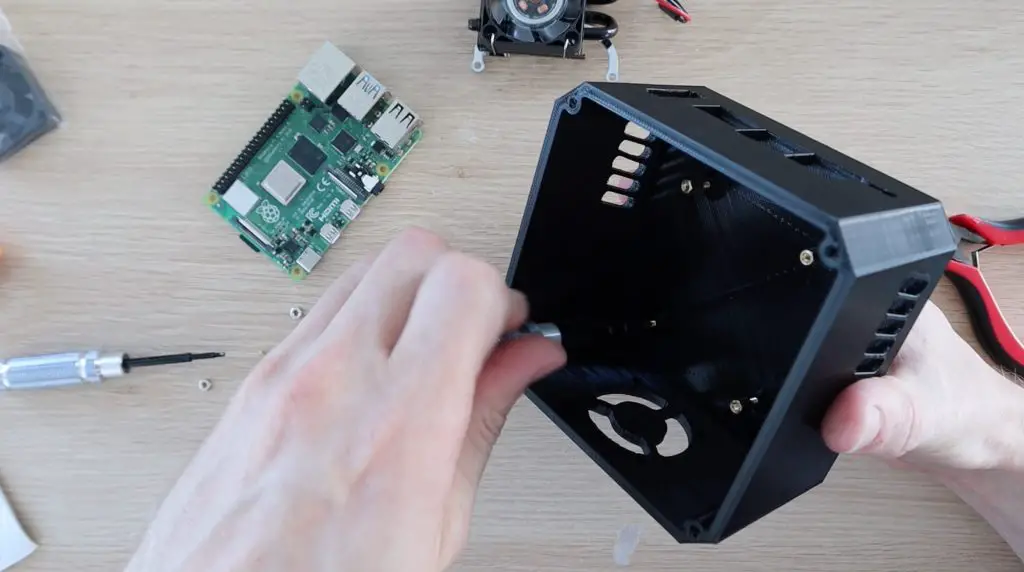
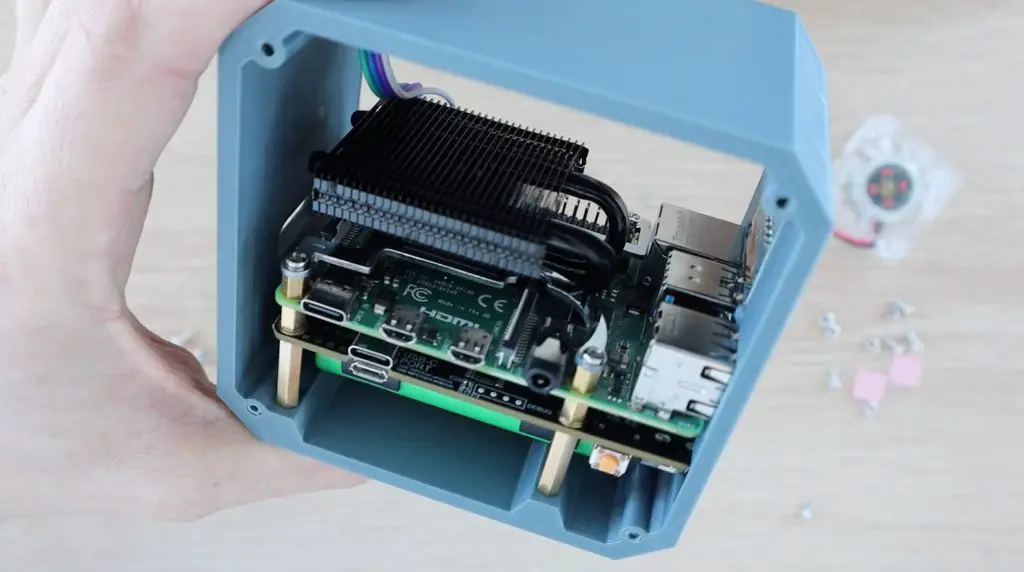
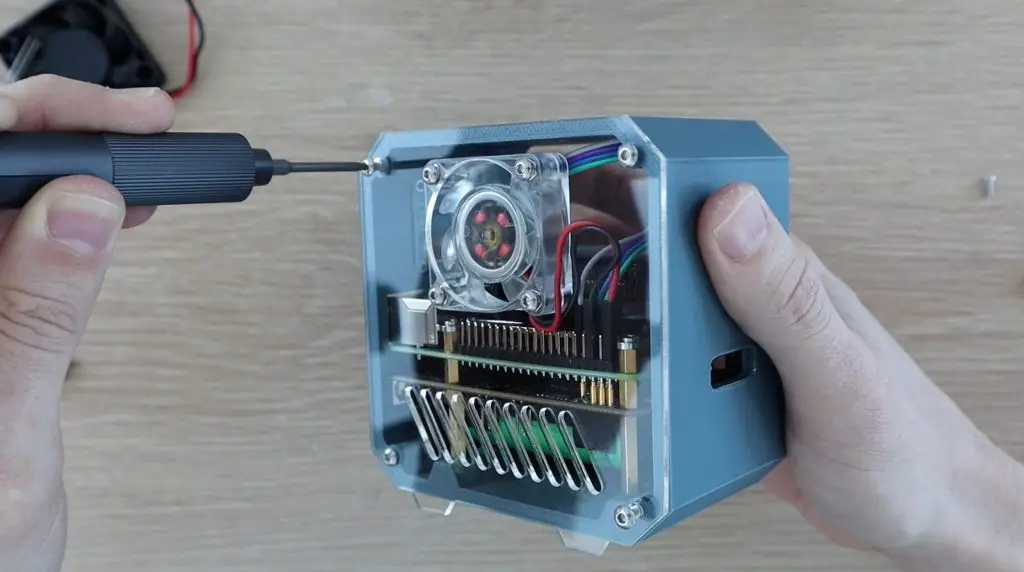
Now we can install the Ice Tower. I removed the fan from the heat sink as I’m going to move this onto the side panel to push air into the entire case. I’m going to use the RGB fan that was supplied with the Ice Tower as an alternative to the plain black one.
Screw the Ice Tower onto the Pi, again making sure that you don’t touch the metal bracket onto any of the components on the Pi or the GPIO pins. Although the Pi may look like it is still off, rather be cautious.
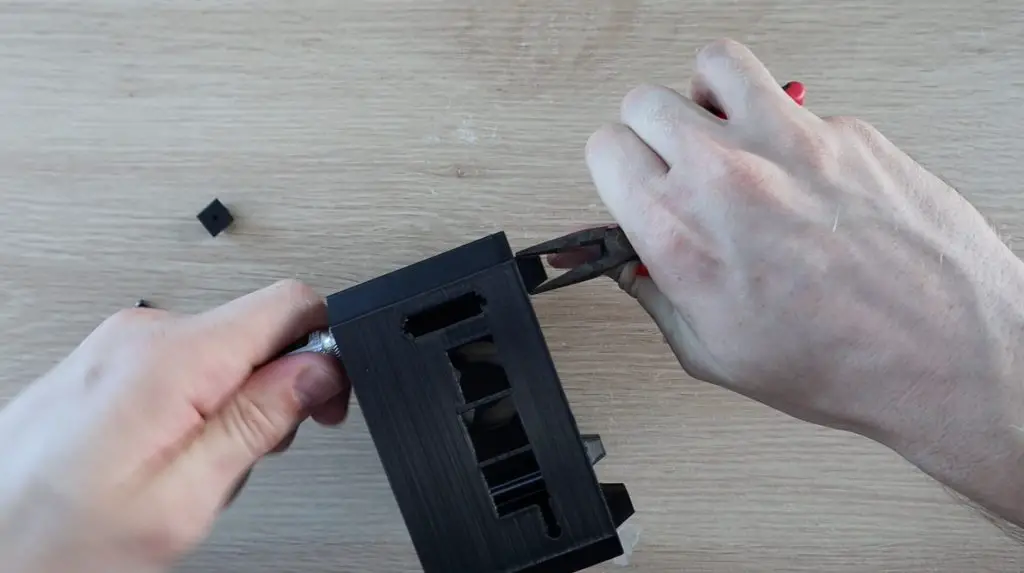
Installing The Side Panels
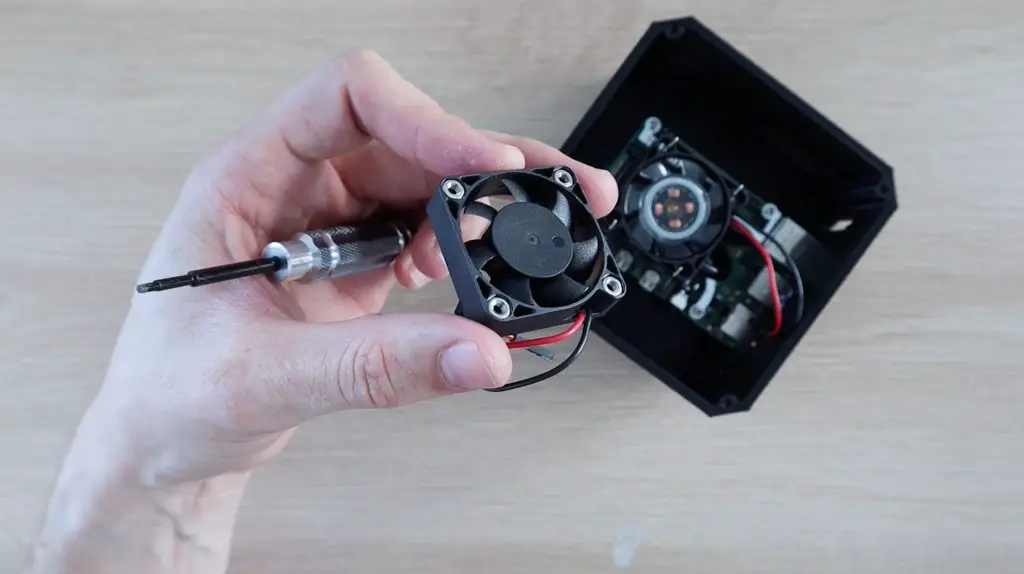
I mounted the fan onto the side panel by pressing some M3 nuts into the pockets on the fan and then screwing the fan into place with some M3x8mm button head screws.
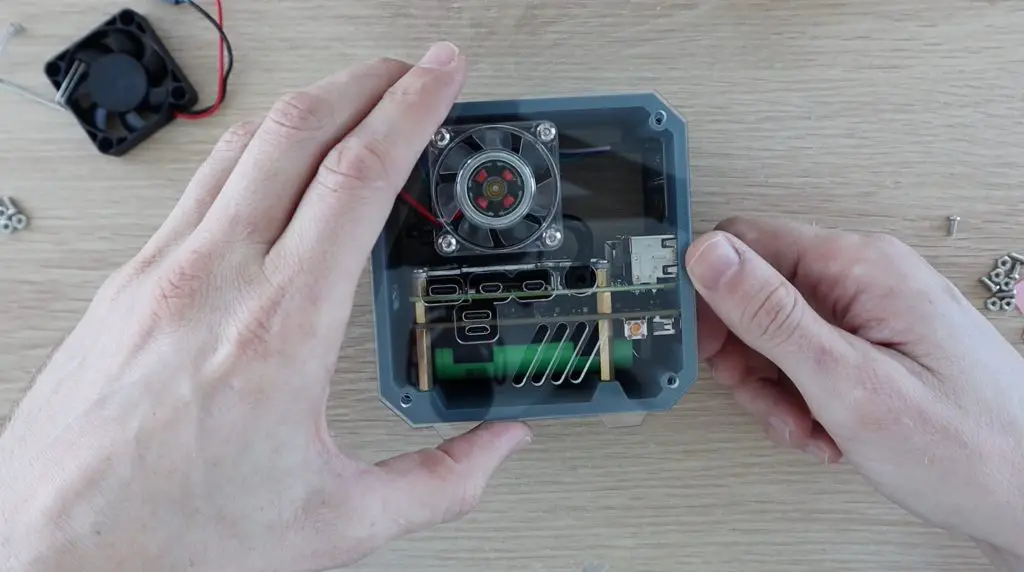
I then tried to fit the side panel. It was at this point that I saw that the Ice Tower is wider than the standard Ice Tower and clashed with the back of the fan. So I had to redesign the side panels to move the fan to the other side.
I then mounted the fan onto the modified side panel, again using the M3x8mm button hex head screws.
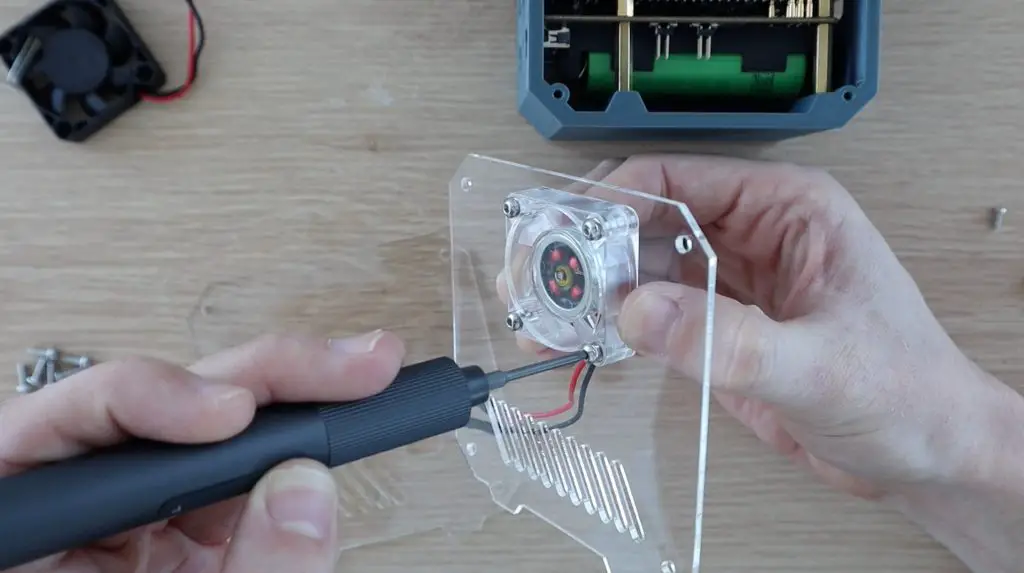
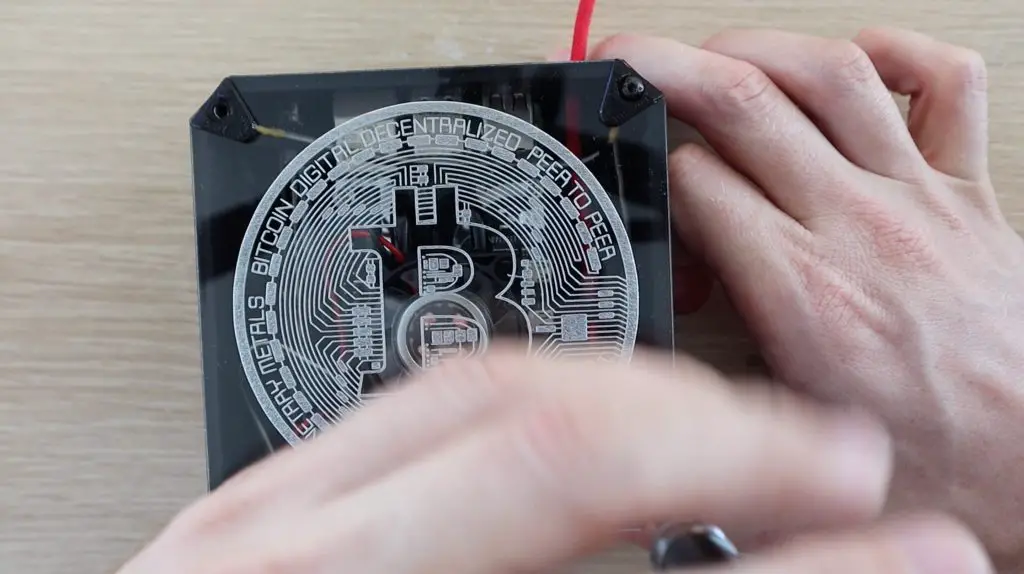
I screwed the two side panels onto the case using some more M3x8mm screws.
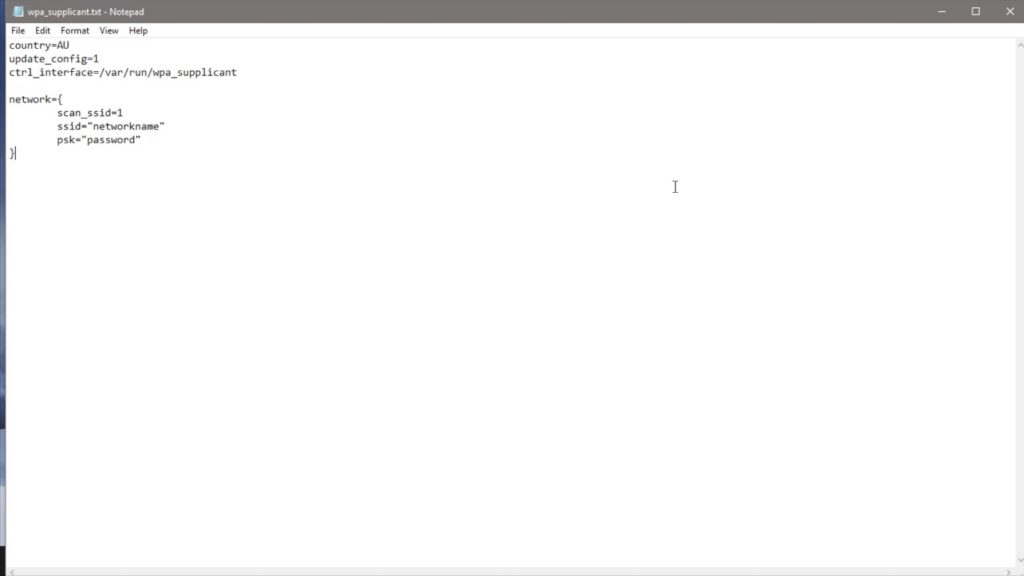
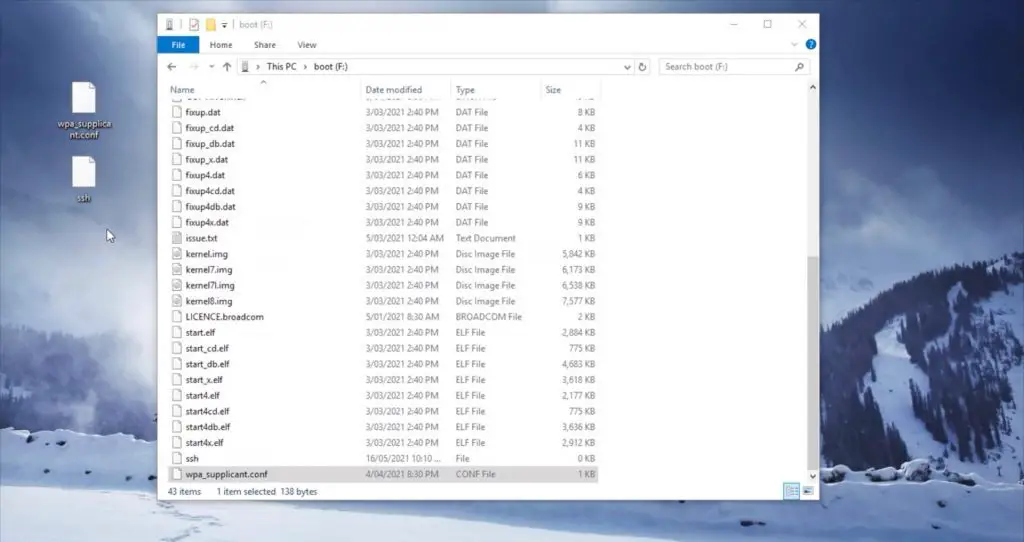
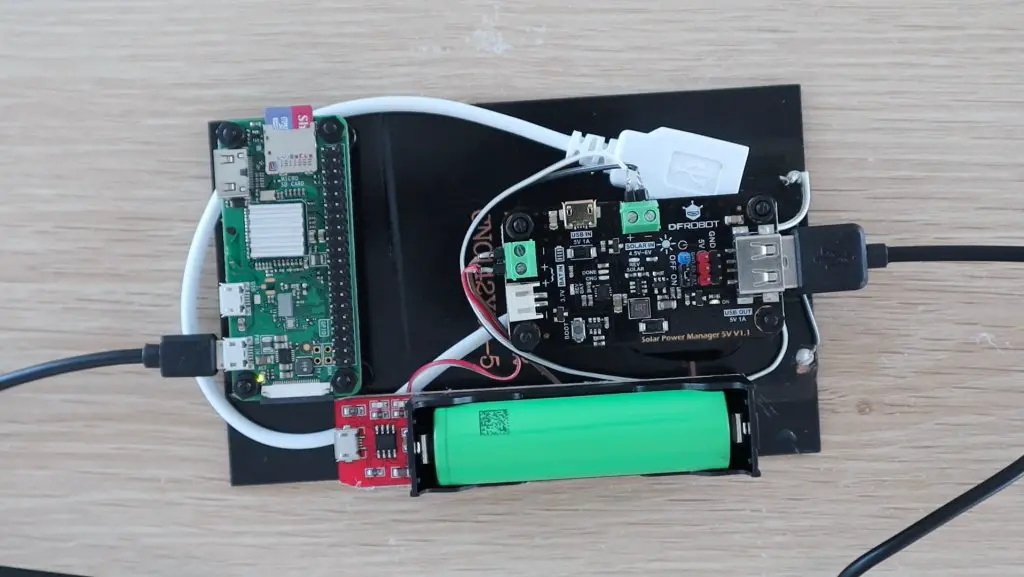
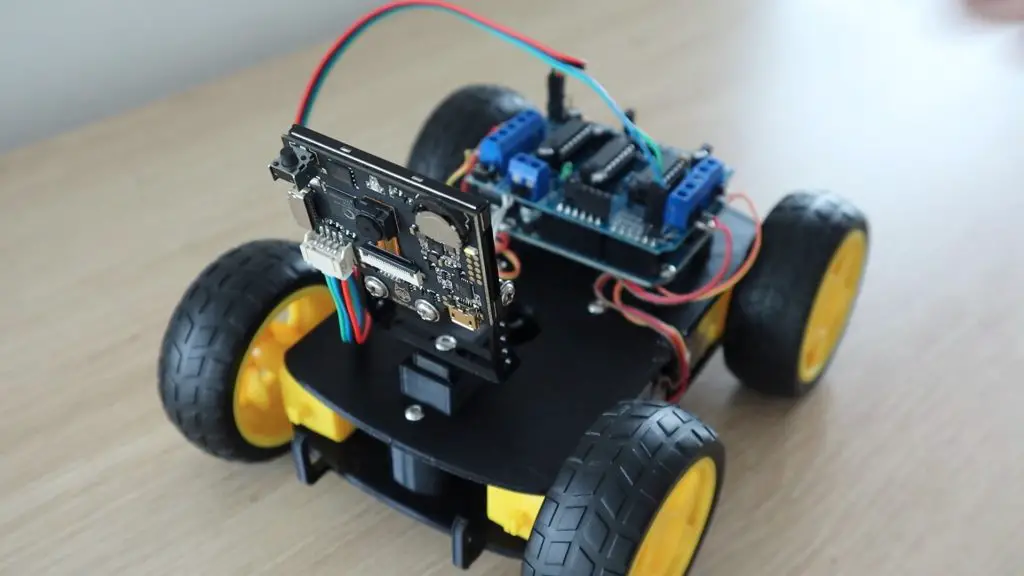
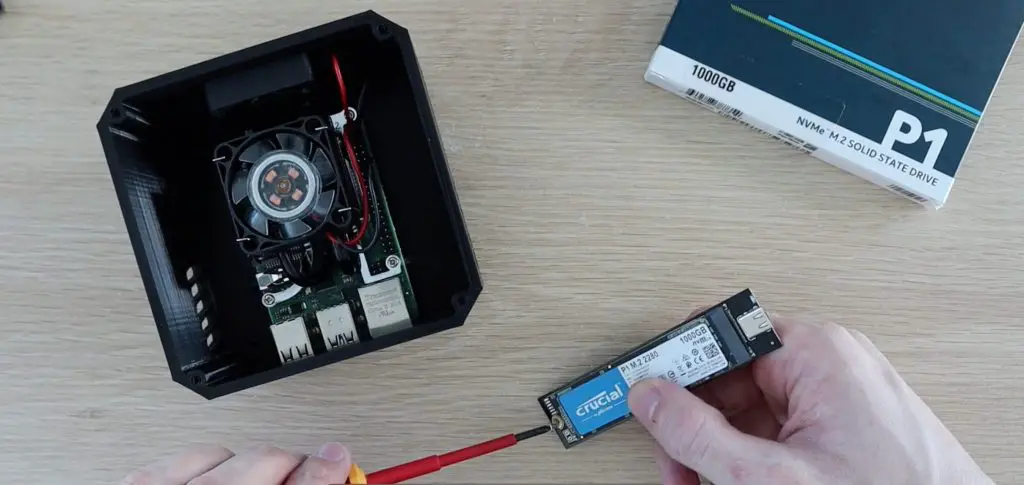
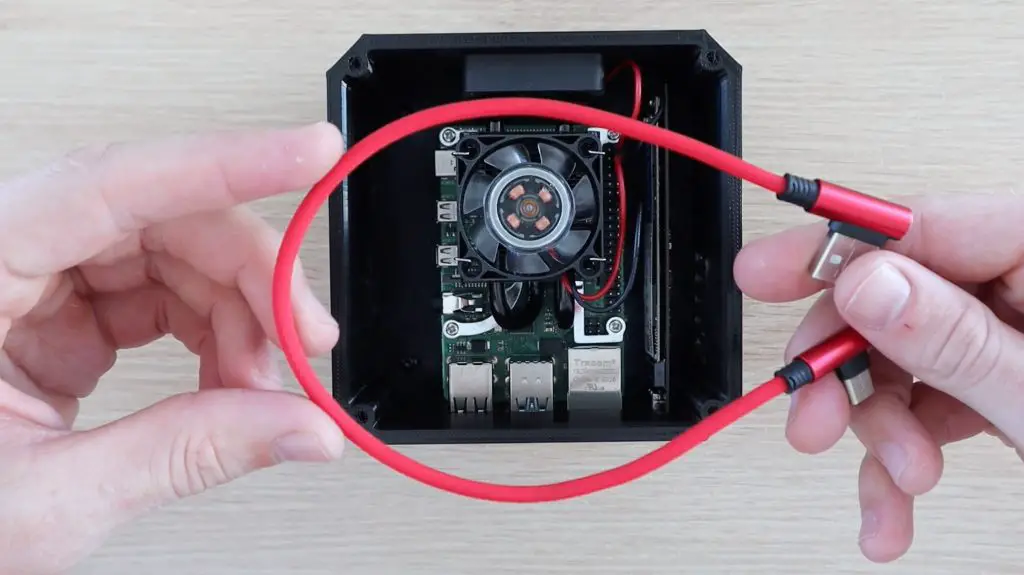
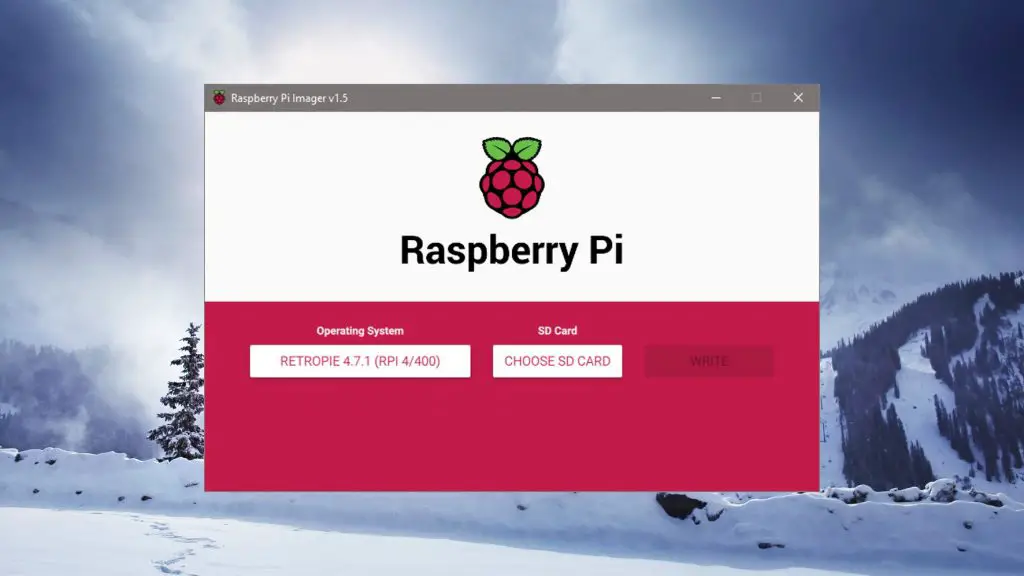
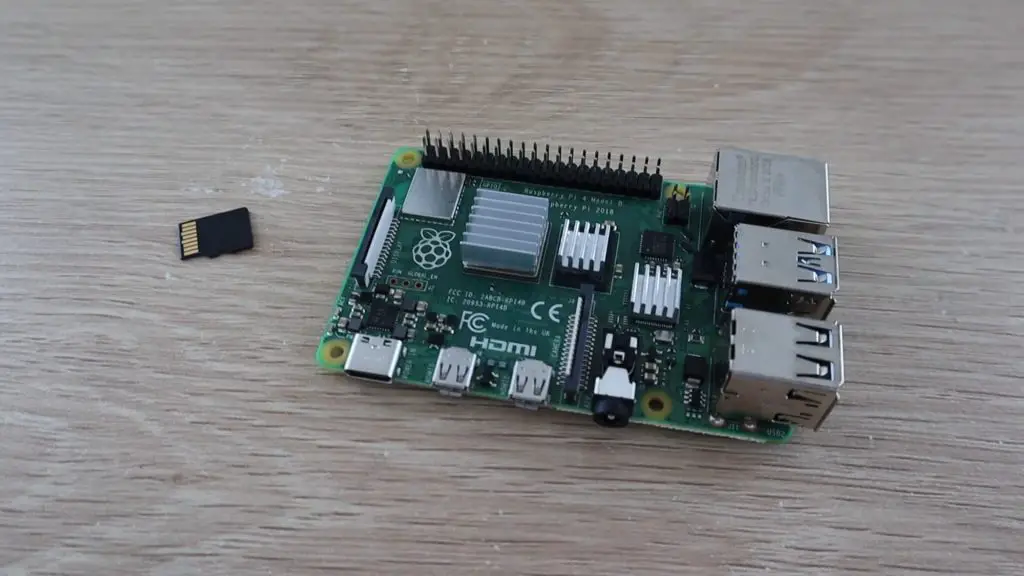
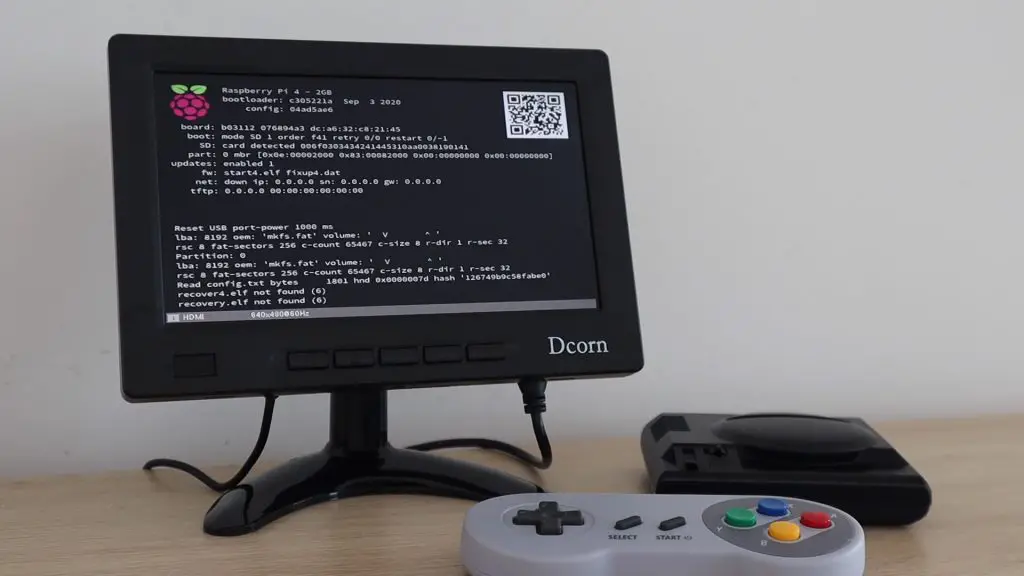
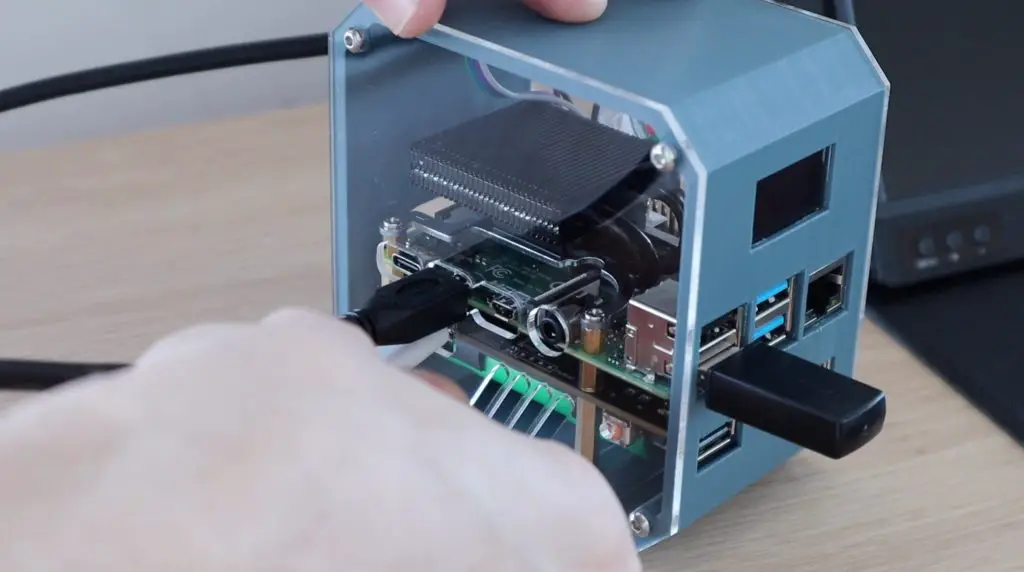
The last thing to do was to put the SD card into the Pi and power it up. I’m using a fresh install of Raspberry Pi OS.
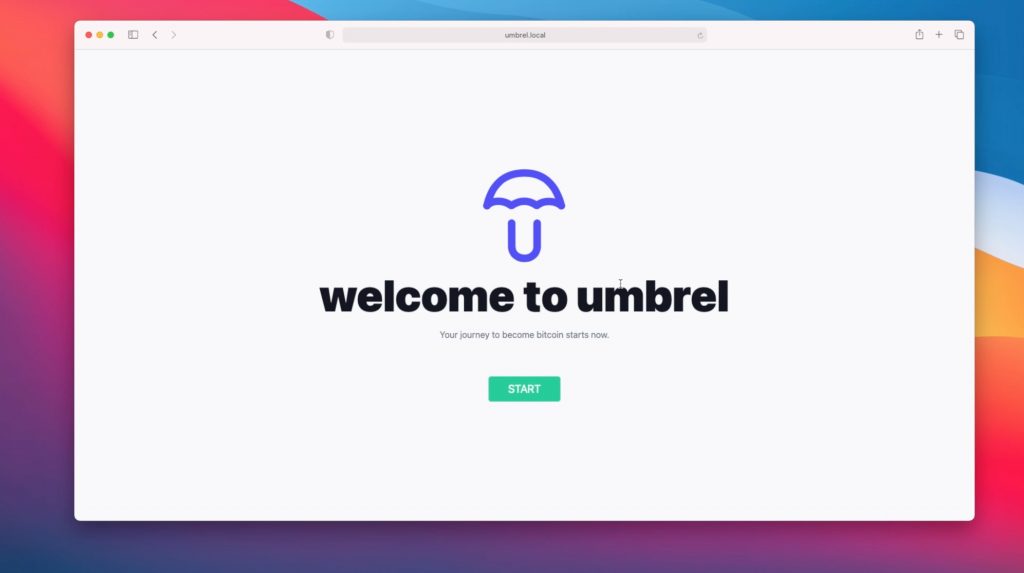
Programming The Raspberry Pi
With the mini server all assembled, we now need to program the Raspberry Pi so that the automatic shutdown works and to get the UPS stats to show up on the OLED display.
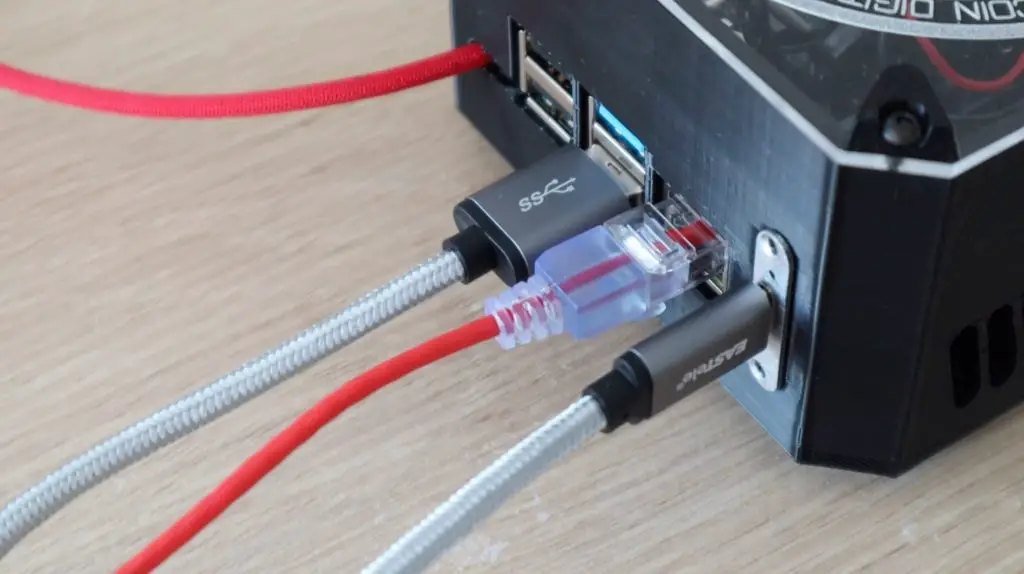
The Pi booted up as soon as the power cable was plugged in, so it looks like the UPS was working correctly so far.
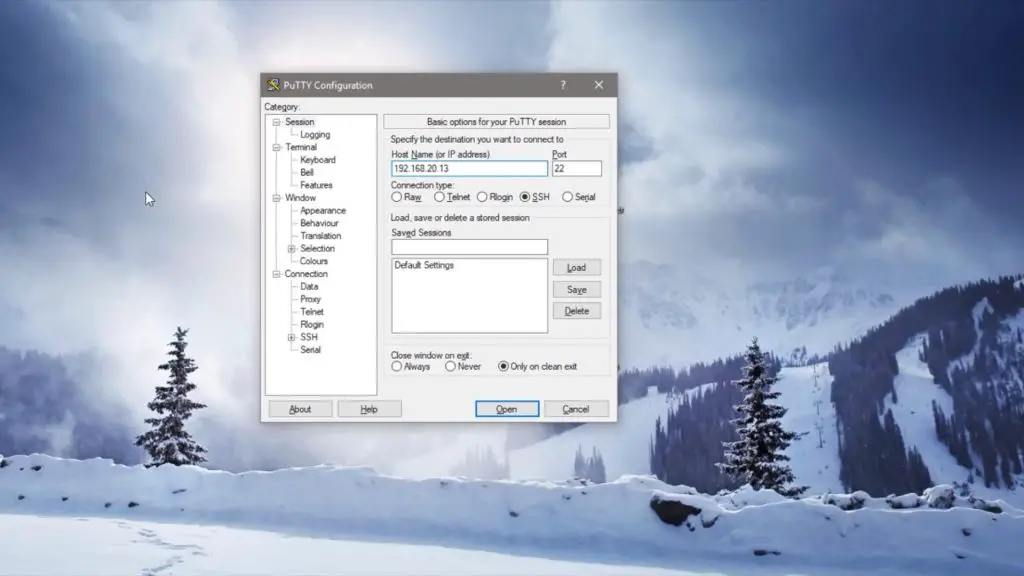
I’m going to go over to the UPS Plus Wiki to see how to install the script that allows automatic shutdown and see what other UPS information is available on the Pi.
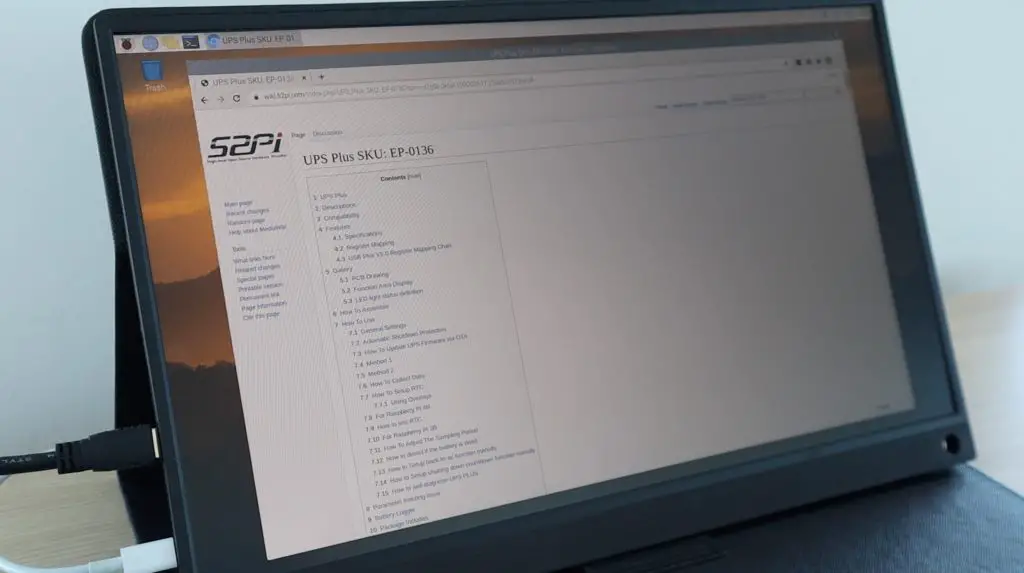
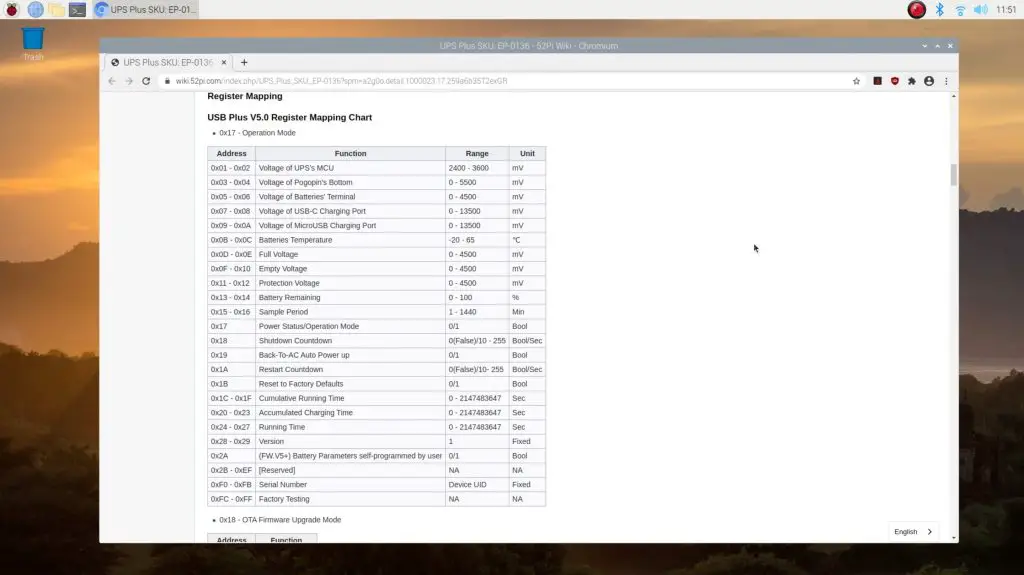
You can see all of the information that is available to be read by the Pi on the Register Mapping chart. It’s a pretty comprehensive list. All of these metrics can be accessed by the Pi through the I2C interface, we can then display the ones we’d like to on the OLED display.
It’s a pretty straightforward process to download the example script that allows you to make changes to the general settings and access the available data on the UPS.
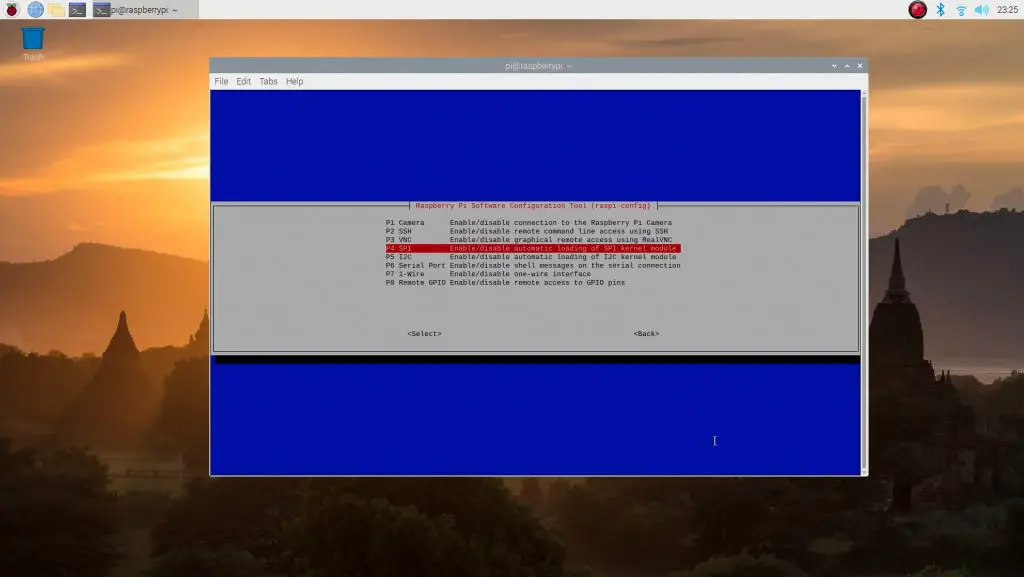
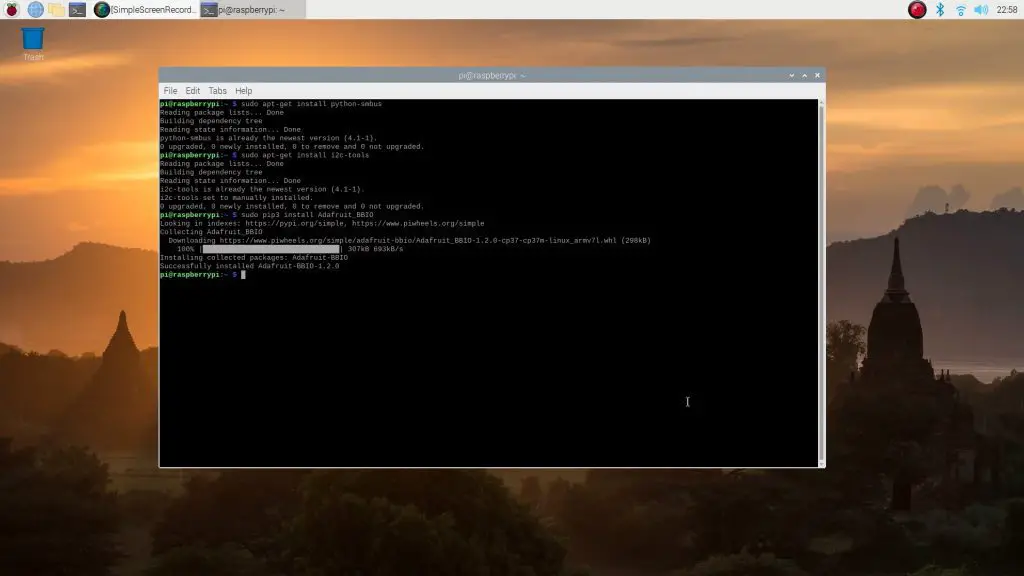
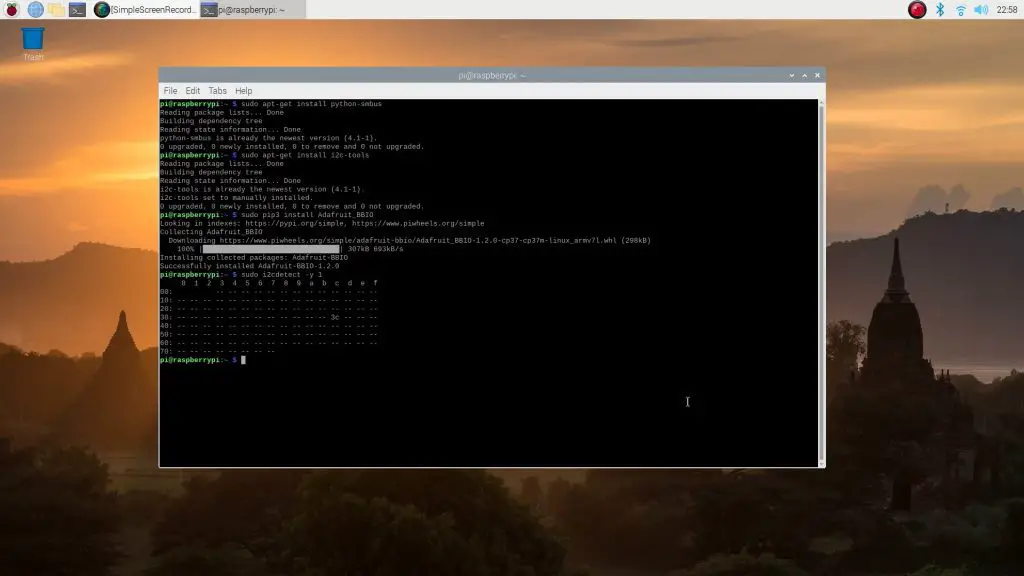
First, ensure that I2C communication is enabled in your preferences menu. Then install the smbus2 library by entering the following command in a new terminal window:
pip install smbus2You can then download the GitHub repository by entering:
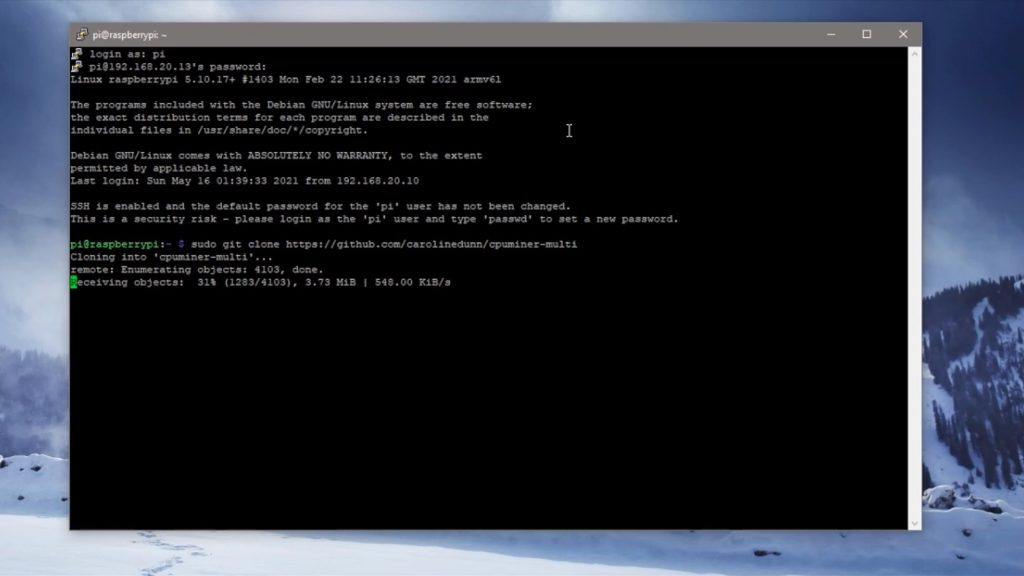
git clone https://github.com/geeekpi/upsplus.gitInstalling The UPS Automatic Shutdown Script
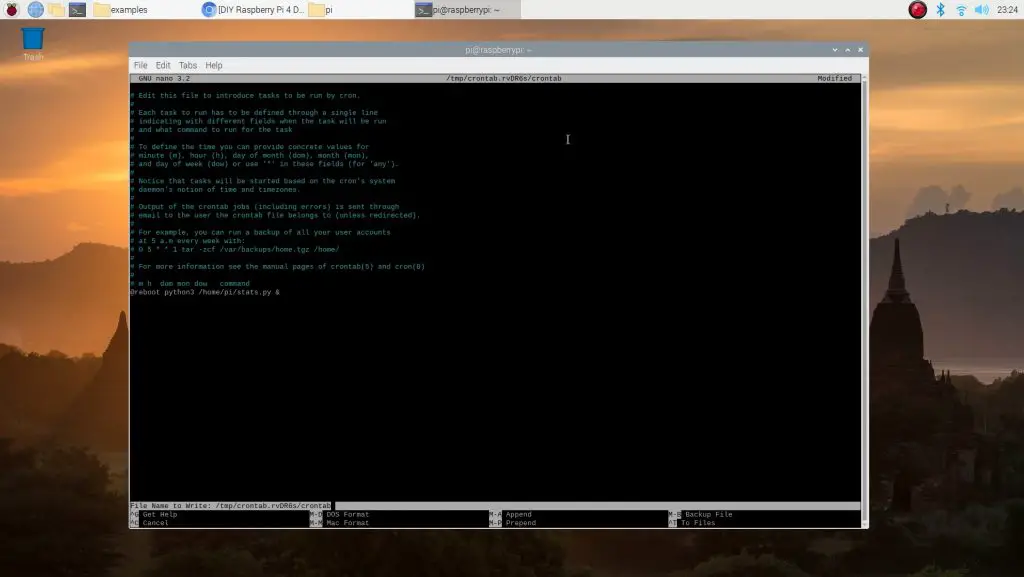
The install the automatic shutdown protection that signals the Pi to shutdown when the battery level becomes critically low, we just run a single line.
curl -Lso- https://raw.githubusercontent.com/geeekpi/upsplus/main/install.sh | bash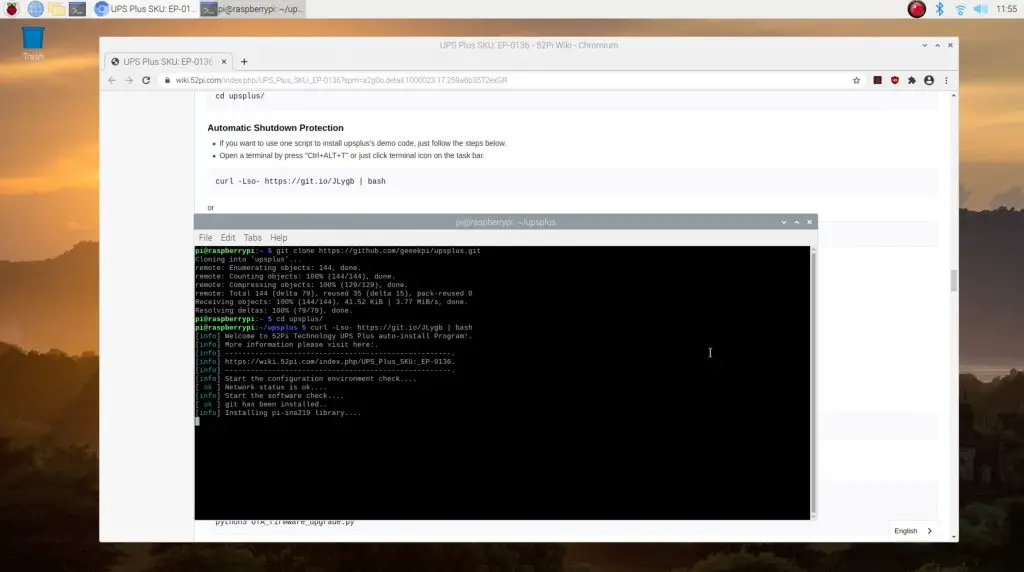
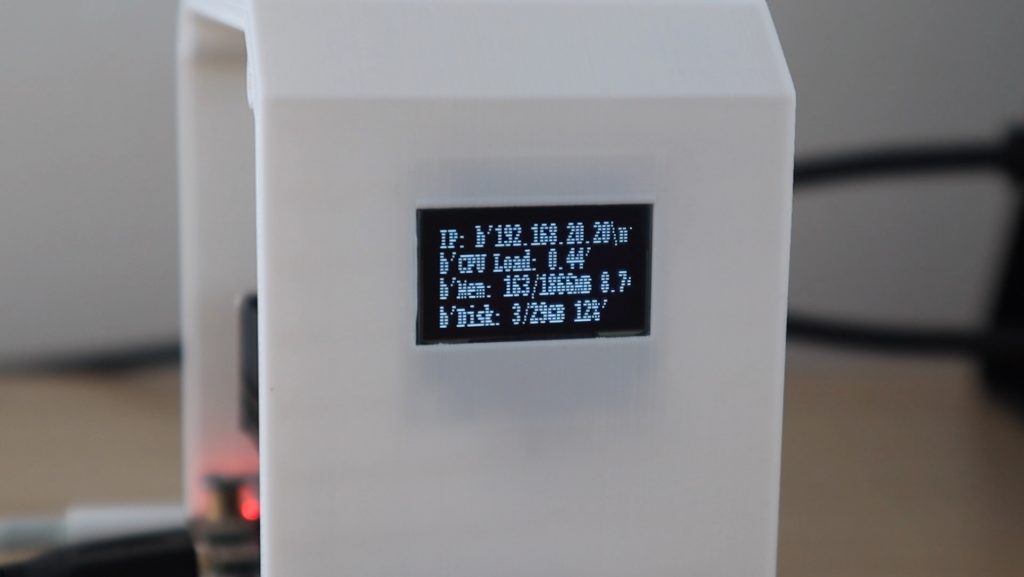
Displaying The UPS Stats On The OLED Display
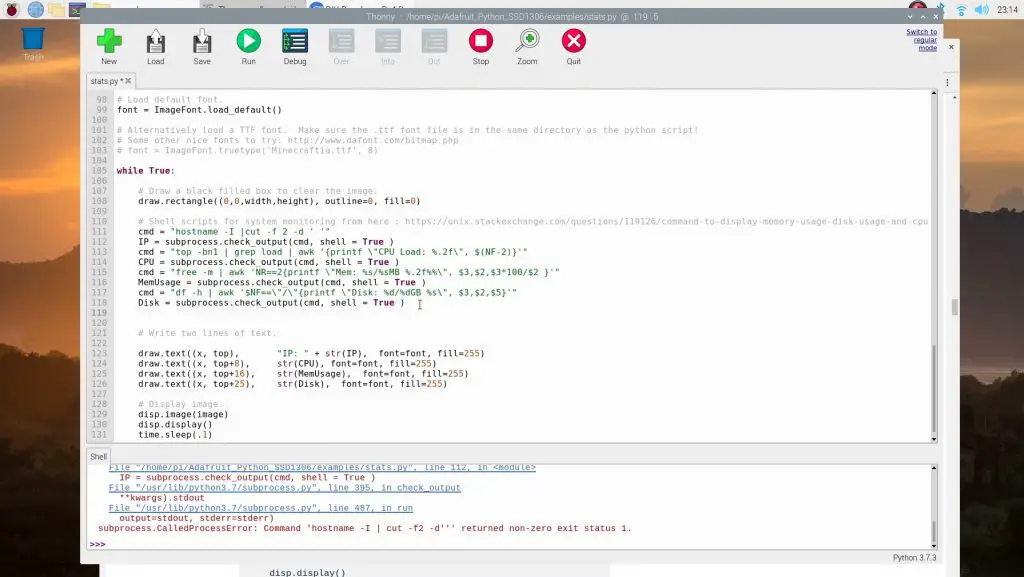
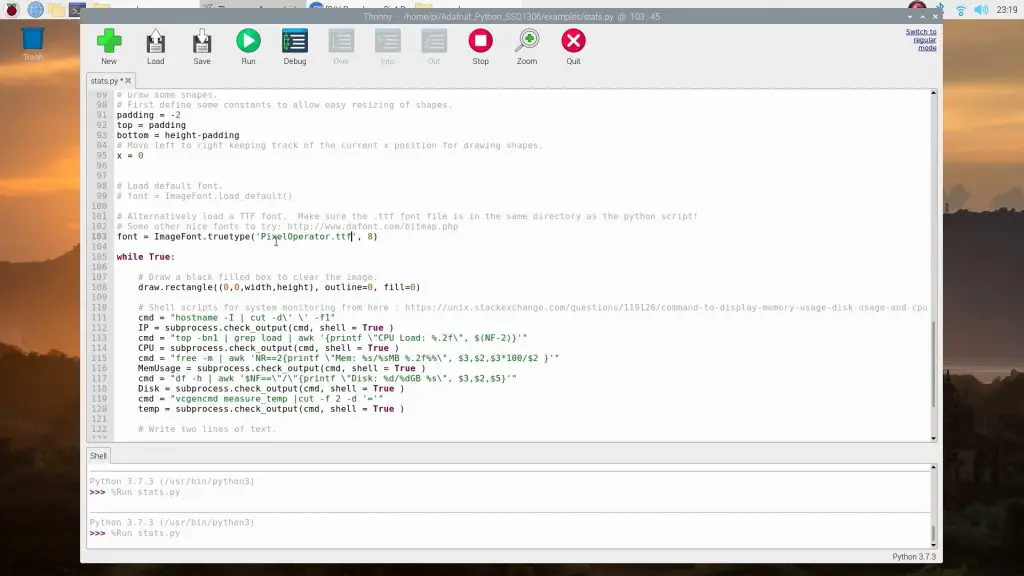
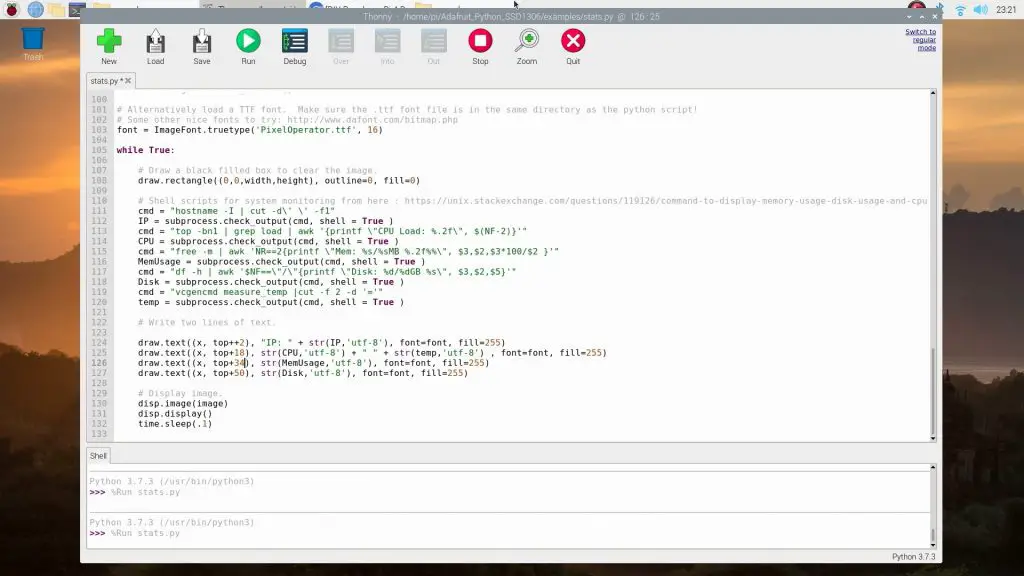
Next, we’ll have a look at the example script and the script that I used previously to display the Pi’s performance stats and integrate the two to produce a second stats display for the UPS that will show us some key UPS information. I’ll also add some code to switch between the two display screens every few seconds.
If we run the example script in the GitHub repository that we downloaded earlier, we get a printout of almost all of the stats available on the UPS.
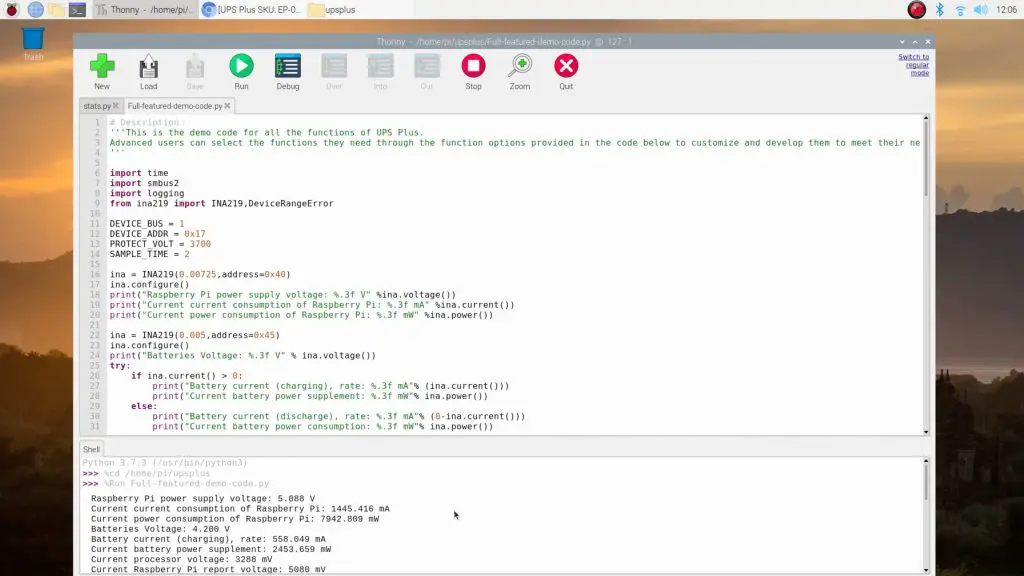
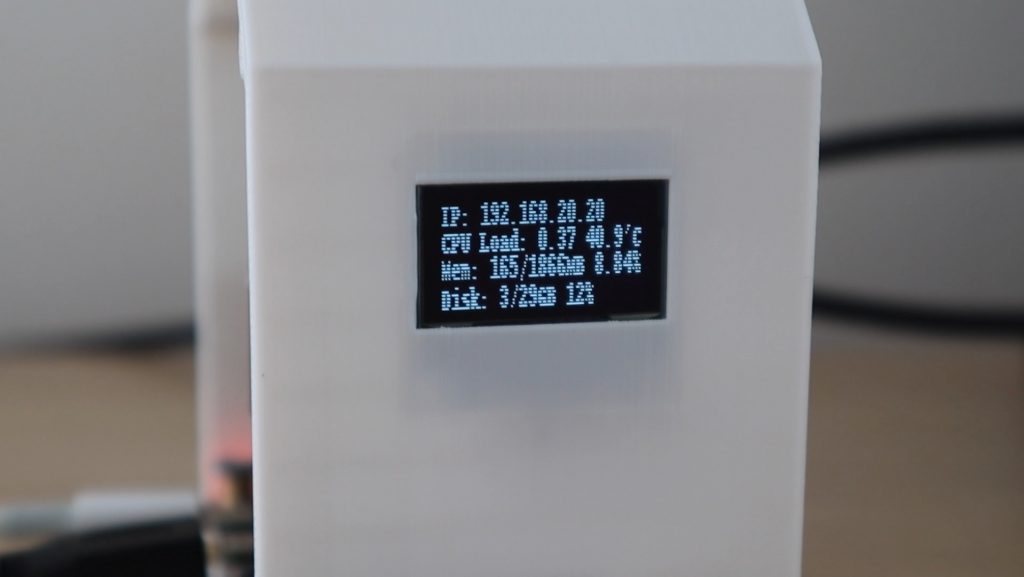
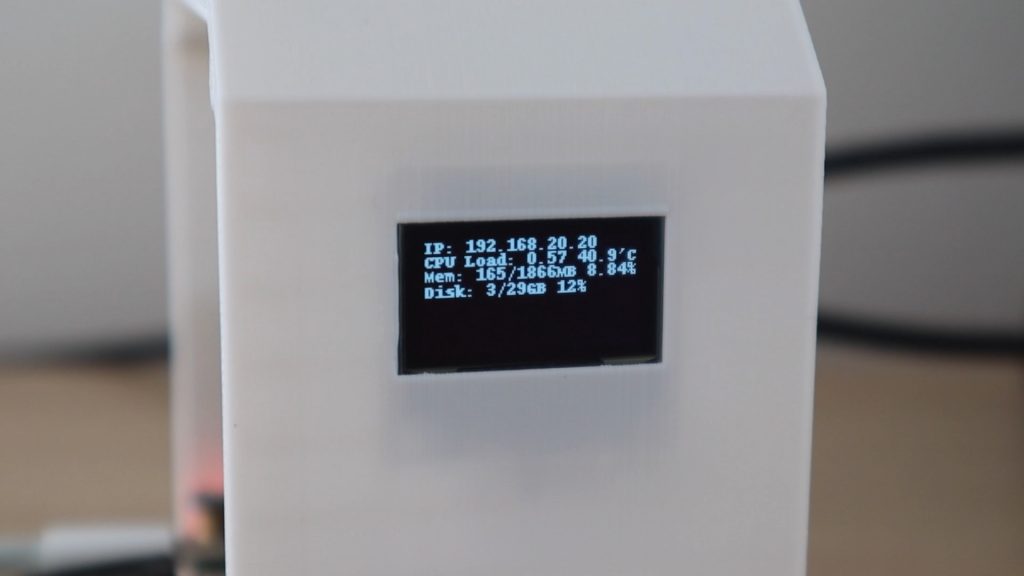
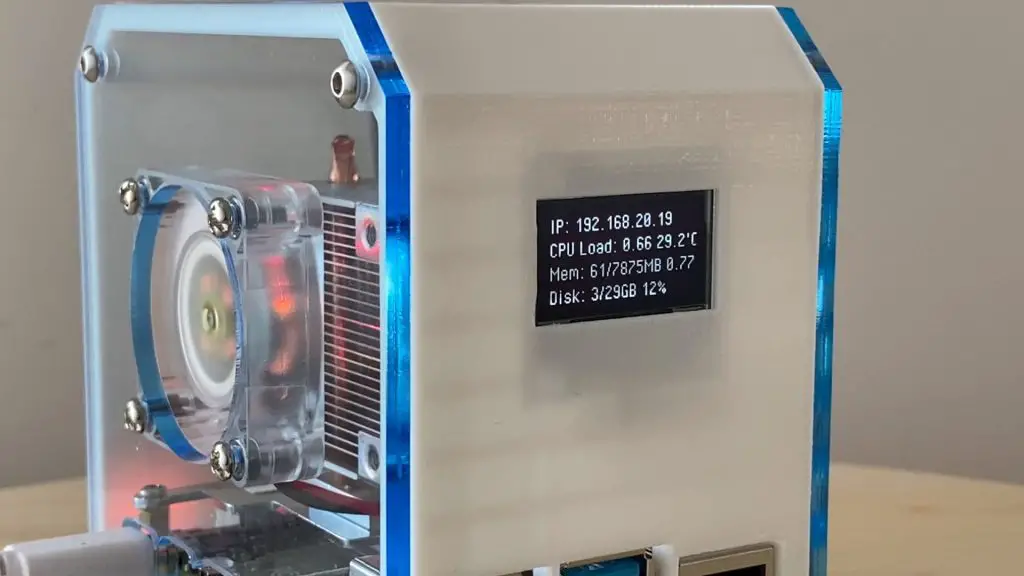
The information I’m going to put on the UPS display is the Pi’s voltage and current being drawn, the battery voltage and capacity, and lastly the charging current and power and charging status. This will allow us to keep an eye on how much power the Pi is using, the state of the UPS battery, and whether we’re charging or discharging the battery.
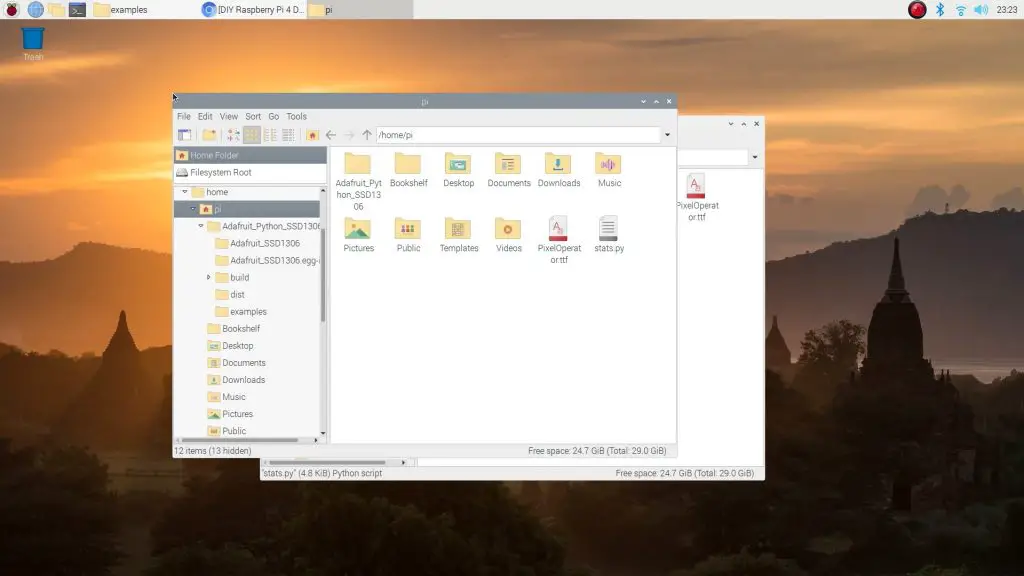
You can download my script below. You’ll need to also download the font PixelOperator.ttf from https://www.dafont.com/pixel-operator.font and then unzip the contents of the download and paste the font into the same folder as the stats.py script.
Dan has made some tweaks to the script to improve stability and has documented the automatic startup of the script on boot, you can find these in his Github repository – danb35/raspi-ups-stats.
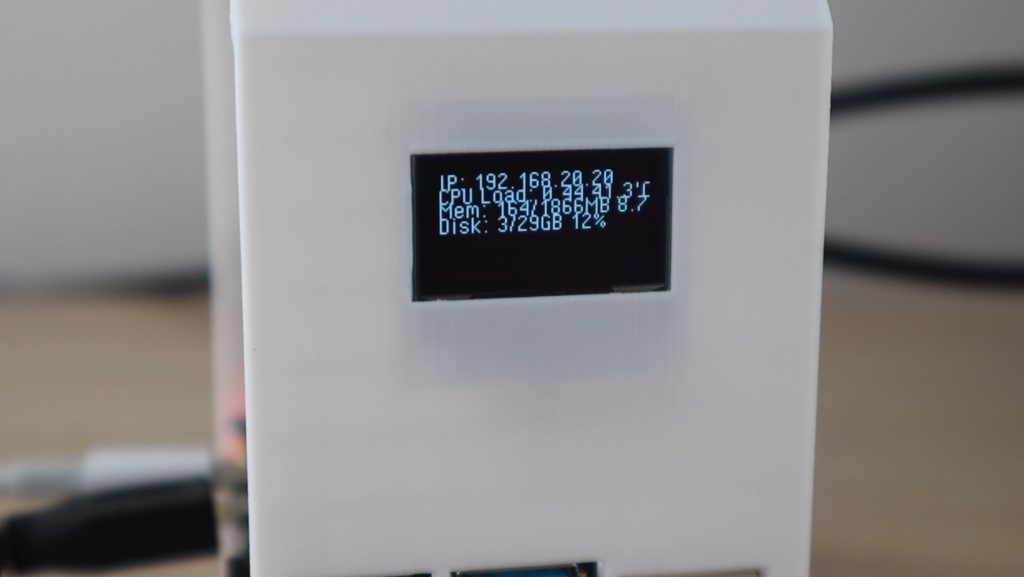
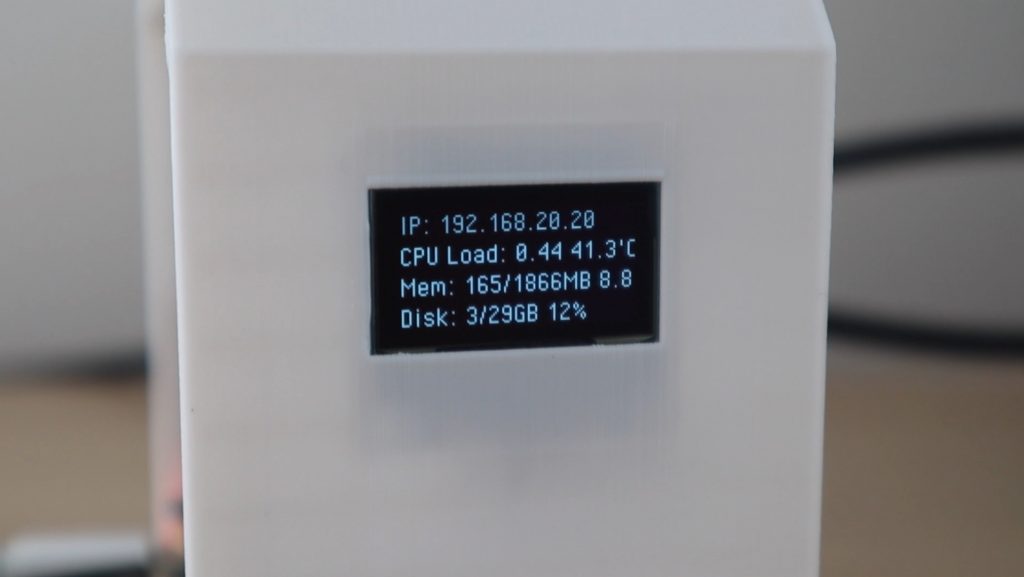
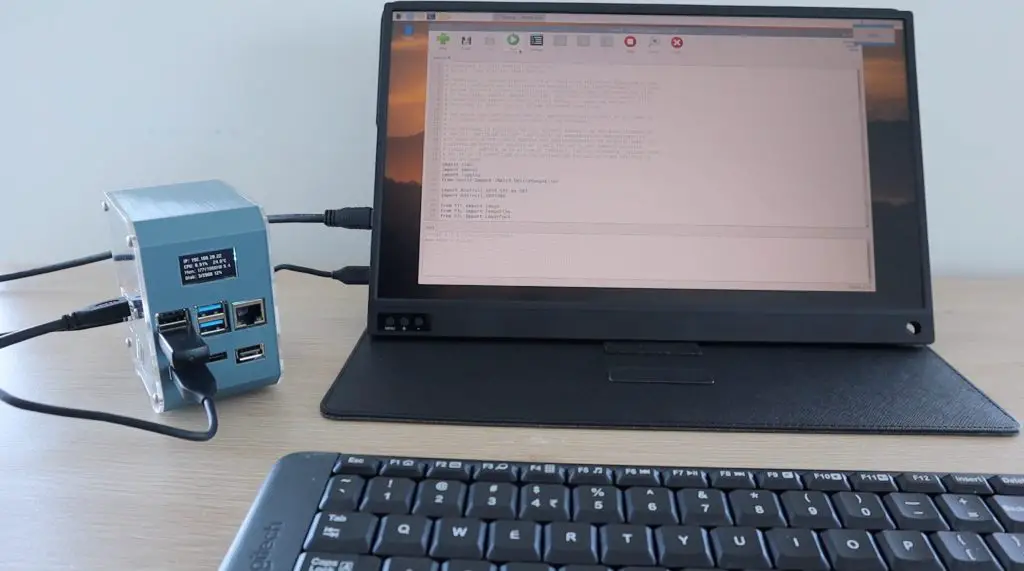
Let’s try and run the script and see what we get on the display.
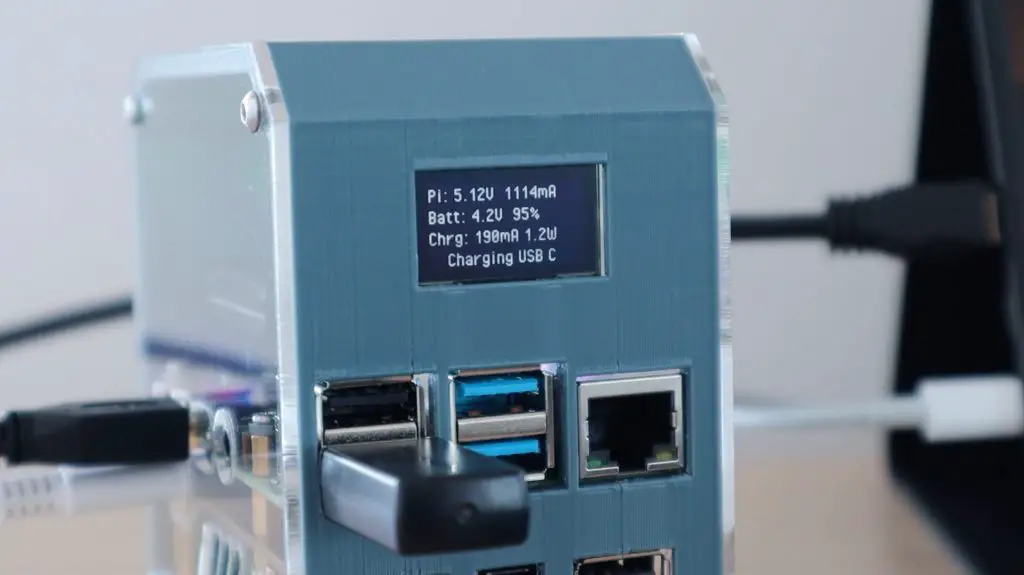
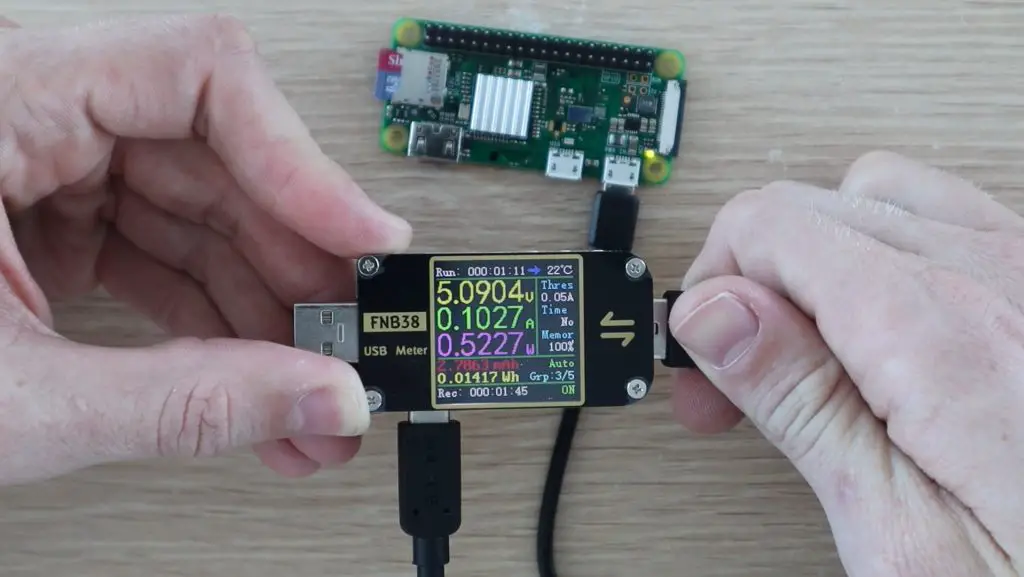
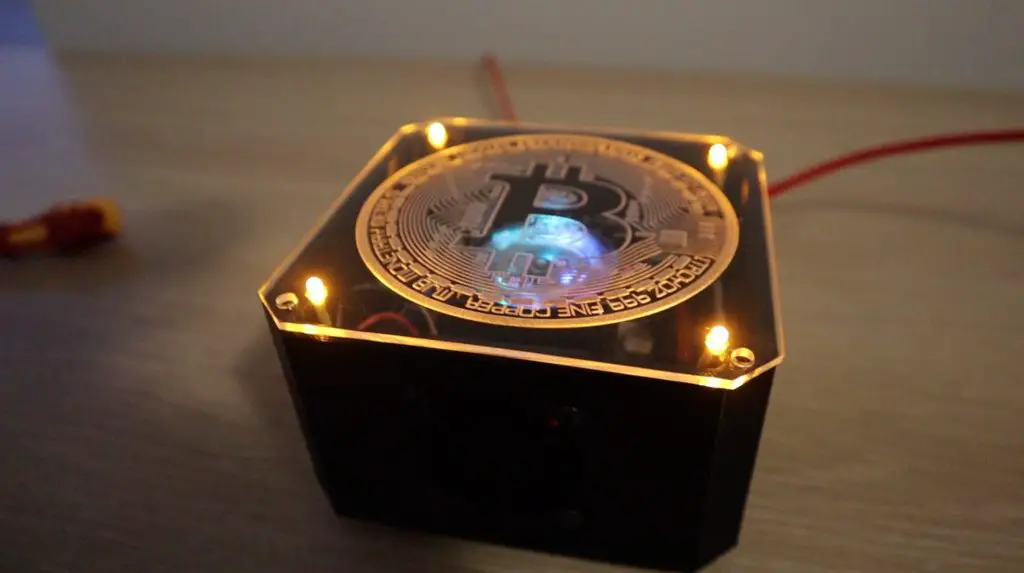
Next let’s test the UPS by pulling out the power cable and make sure that the Pi keeps running and that the display shows us the battery level and correct charging status.
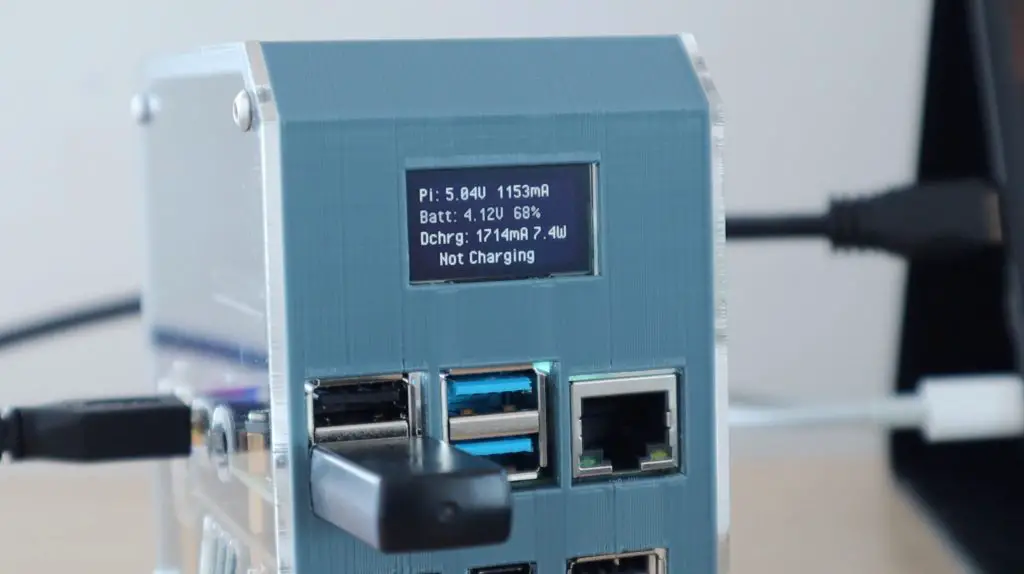
So it looks like that’s all working correctly.
Further Testing The UPS Plus Module
I was able to get just under an hour and a half of runtime from a fully charged set of batteries. This would obviously depend on the capacity of your batteries. For most people, this would be long enough to ride out a short power interruption and your Pi would be safely shut down if the interruption lasted longer than this.
I also wanted to see if I could plug the display’s power cable into the UPS as well, powering my whole setup from the UPS.
The display came on and it looked like the UPS had enough capacity to power the display as well, although this is pretty close to its 4A limit.
There were two issues that I found with the UPS through my testing. Both of them probably won’t affect you if you plan to run the UPS continuously, like most people do, but would also have a common and fairly simple solution.
The first is isolating the batteries. If I designed that case a bit better I’d be able to install the batteries after installing the UPS, but it would be nice to have a physical switch to isolate the batteries from the board when you didn’t want any power on the board. At the moment, when the batteries are in the UPS, you need to be careful not to touch any of the components or PCB traces or you might damage it.
The second is a physical means to turn off the UPS, which could be done with the same isolation switch. The board has a function button on the side, but I haven’t been able to find any information on what it is actually supposed to do.
The board does turn off or on if you push the button, but on two occasions I’ve turned the board off using this switch and come back after 10-15 minutes and the board has come back on again and powered the Pi up.
If the UPS does startup accidentally while the batteries are low then there might be a situation where the Pi hasn’t finished booting up and the batteries die completely. This interruption during booting might result in corrupting the SD card. A physical switch would just provide that extra level of protection against an accidental startup.
Other than the isolation of the batteries this UPS is a really neat and compact solution to provide a reliable battery backup to your Pi with automatic safe shutdown and stats available.
Let me know what you think of it in the comments section below.